📊 Financial Analysis · tap to collapse
📊 Financial Model
A: own-use · B: investment · both 80% LTV · 1.4% p.a. · 17% corp tax
Remaining lease
41 yrs remaining
Expires ~2067
Acquisition costs
| Purchase price | S$860,000 |
| BSD (non-residential) | S$20,400 |
| Legal fees (est.) | S$3,500 |
| ↳ Down payment (20%) + BSD + legal | S$195,900 |
| ↳ Loan (80%) | S$688,000 |
| ↳ Scenario B equity (same) | S$195,900 |
Monthly mortgage & opex
| Mgmt fee (0.70 psf/mo) | S$377 |
| Property tax (10% of AV S$35,508) | S$296 |
Rental scenarios
A · Own-use (80% LTV)
Rent covers mortgage + mgmt + property tax
S$3,329 /mo · 6.19 psf
| Mortgage (30yr @ 1.4%) | S$2,342 |
| ↳ interest / principal | S$803 / S$1,539 |
| Corp tax (17%) | S$315 |
| Net cash flow | −S$0/mo shortfall |
| Gross yield | 4.65% |
| Cap rate | 3.71% |
9.43%
equity return
cf + principal / equity in
cf + principal / equity in
vs
B · Investment (80% LTV)
Market rent 5.50 psf · equity S$195,900
S$2,959 /mo · 5.50 psf
| Mortgage (30yr @ 1.4%) | S$2,342 |
| ↳ interest / principal | S$803 / S$1,539 |
| Corp tax (17%) | S$252 |
| Net cash flow | −S$307/mo shortfall |
| Gross yield | 4.13% |
| Cap rate | 3.19% |
7.54%
equity return
cf + principal / equity in
cf + principal / equity in
A charges S$3,329/mo to own business vs market rent S$2,959/mo
(+S$370/mo vs market).
Yr1 principal paydown: S$18,467/yr (locked equity).
1.4% p.a. (midpoint of 1.2–1.6% market range) · A: own-use · B: investment · both 80% LTV ·
0.70 psf mgmt · 10% property tax on AV · 17% CIT · Non-res BSD · No ABSD.
Market rent based on zone Grade B/C comps. Not financial advice.
📉 Scenario C: Run-to-end (no exit) · tap to expand
📉 Scenario C · Leasehold Run-to-end
No exit sale · 2% rent p.a. · 80% LTV · hold 41 yrs to lease expiry
Loan paydown equity is trapped — cannot be realised without a buyer.
Returns below are purely from net rental cash flows.
Rent & occupancy assumptions
| Yr 1–10 | Company own-use · BE rent · CF ≈ 0 |
| Yr 11–30 | External tenant · 90% occ · market rent |
| Yr 31+ | External tenant · 80% occ · market rent |
| Rent growth | 2% p.a. · decays as lease shortens |
| Property tax | Tracks rent (AV-based) · flat during own-use |
| Terminal / exit value | S$0 |
Cash flow summary
Avg CF over each period. Yr 1–10 ≈ S$0/yr (BE rent covers costs). Turns positive post-loan.
| Equity invested (80% LTV) | S$195,900 |
| Avg annual CF · loan period (30 yrs) | S$1,825/yr S$152/mo |
| Avg annual CF · post-loan (11 yrs) | S$33,279/yr S$2,773/mo |
| Total cash back over 41 yrs | S$420,809 |
| Net profit / (loss) | +S$224,909 |
2.2%
IRR over 41 yrs
no exit · 2% rent p.a. · 100%/90%/80% occ by decade
no exit · 2% rent p.a. · 100%/90%/80% occ by decade
📊 Financial Analysis · tap to collapse
📊 Financial Model
A: own-use · B: investment · both 80% LTV · 1.4% p.a. · 17% corp tax
Remaining lease
41 yrs remaining
Expires ~2067
Acquisition costs
| Purchase price | S$800,000 |
| BSD (non-residential) | S$18,600 |
| Legal fees (est.) | S$3,500 |
| ↳ Down payment (20%) + BSD + legal | S$182,100 |
| ↳ Loan (80%) | S$640,000 |
| ↳ Scenario B equity (same) | S$182,100 |
Monthly mortgage & opex
| Mgmt fee (0.70 psf/mo) | S$302 |
| Property tax (10% of AV S$28,446) | S$237 |
Rental scenarios
A · Own-use (80% LTV)
Rent covers mortgage + mgmt + property tax
S$3,010 /mo · 6.98 psf
| Mortgage (30yr @ 1.4%) | S$2,178 |
| ↳ interest / principal | S$747 / S$1,432 |
| Corp tax (17%) | S$293 |
| Net cash flow | −S$0/mo shortfall |
| Gross yield | 4.52% |
| Cap rate | 3.71% |
9.43%
equity return
cf + principal / equity in
cf + principal / equity in
vs
B · Investment (80% LTV)
Market rent 5.50 psf · equity S$182,100
S$2,370 /mo · 5.50 psf
| Mortgage (30yr @ 1.4%) | S$2,178 |
| ↳ interest / principal | S$747 / S$1,432 |
| Corp tax (17%) | S$184 |
| Net cash flow | −S$531/mo shortfall |
| Gross yield | 3.55% |
| Cap rate | 2.75% |
5.93%
equity return
cf + principal / equity in
cf + principal / equity in
A charges S$3,010/mo to own business vs market rent S$2,370/mo
(+S$640/mo vs market).
Yr1 principal paydown: S$17,178/yr (locked equity).
1.4% p.a. (midpoint of 1.2–1.6% market range) · A: own-use · B: investment · both 80% LTV ·
0.70 psf mgmt · 10% property tax on AV · 17% CIT · Non-res BSD · No ABSD.
Market rent based on zone Grade B/C comps. Not financial advice.
📉 Scenario C: Run-to-end (no exit) · tap to expand
📉 Scenario C · Leasehold Run-to-end
No exit sale · 2% rent p.a. · 80% LTV · hold 41 yrs to lease expiry
Loan paydown equity is trapped — cannot be realised without a buyer.
Returns below are purely from net rental cash flows.
Rent & occupancy assumptions
| Yr 1–10 | Company own-use · BE rent · CF ≈ 0 |
| Yr 11–30 | External tenant · 90% occ · market rent |
| Yr 31+ | External tenant · 80% occ · market rent |
| Rent growth | 2% p.a. · decays as lease shortens |
| Property tax | Tracks rent (AV-based) · flat during own-use |
| Terminal / exit value | S$0 |
Cash flow summary
Avg CF over each period. Yr 1–10 ≈ S$0/yr (BE rent covers costs). Turns positive post-loan.
| Equity invested (80% LTV) | S$182,100 |
| Avg annual CF · loan period (30 yrs) | S$-914/yr S$-76/mo |
| Avg annual CF · post-loan (11 yrs) | S$26,661/yr S$2,222/mo |
| Total cash back over 41 yrs | S$265,849 |
| Net profit / (loss) | +S$83,749 |
1.0%
IRR over 41 yrs
no exit · 2% rent p.a. · 100%/90%/80% occ by decade
no exit · 2% rent p.a. · 100%/90%/80% occ by decade
Beach Road
99LH
The Plaza
S$414,999 S$1,482 psf
280 sqft · CC5 Nicoll Highway
Agent: Marc Lee
2 other agent(s) listing this unit
📊 Financial Analysis · tap to collapse
📊 Financial Model
A: own-use · B: investment · both 80% LTV · 1.4% p.a. · 17% corp tax
Remaining lease
41 yrs remaining
Expires ~2067
Acquisition costs
| Purchase price | S$414,999 |
| BSD (non-residential) | S$7,050 |
| Legal fees (est.) | S$3,500 |
| ↳ Down payment (20%) + BSD + legal | S$93,550 |
| ↳ Loan (80%) | S$331,999 |
| ↳ Scenario B equity (same) | S$93,550 |
Monthly mortgage & opex
| Mgmt fee (0.70 psf/mo) | S$196 |
| Property tax (10% of AV S$18,480) | S$154 |
Rental scenarios
A · Own-use (80% LTV)
Rent covers mortgage + mgmt + property tax
S$1,632 /mo · 5.83 psf
| Mortgage (30yr @ 1.4%) | S$1,130 |
| ↳ interest / principal | S$387 / S$743 |
| Corp tax (17%) | S$152 |
| Net cash flow | −S$0/mo shortfall |
| Gross yield | 4.72% |
| Cap rate | 3.71% |
9.53%
equity return
cf + principal / equity in
cf + principal / equity in
vs
B · Investment (80% LTV)
Market rent 5.50 psf · equity S$93,550
S$1,540 /mo · 5.50 psf
| Mortgage (30yr @ 1.4%) | S$1,130 |
| ↳ interest / principal | S$387 / S$743 |
| Corp tax (17%) | S$136 |
| Net cash flow | −S$76/mo shortfall |
| Gross yield | 4.45% |
| Cap rate | 3.44% |
8.55%
equity return
cf + principal / equity in
cf + principal / equity in
A charges S$1,632/mo to own business vs market rent S$1,540/mo
(+S$92/mo vs market).
Yr1 principal paydown: S$8,911/yr (locked equity).
1.4% p.a. (midpoint of 1.2–1.6% market range) · A: own-use · B: investment · both 80% LTV ·
0.70 psf mgmt · 10% property tax on AV · 17% CIT · Non-res BSD · No ABSD.
Market rent based on zone Grade B/C comps. Not financial advice.
📉 Scenario C: Run-to-end (no exit) · tap to expand
📉 Scenario C · Leasehold Run-to-end
No exit sale · 2% rent p.a. · 80% LTV · hold 41 yrs to lease expiry
Loan paydown equity is trapped — cannot be realised without a buyer.
Returns below are purely from net rental cash flows.
Rent & occupancy assumptions
| Yr 1–10 | Company own-use · BE rent · CF ≈ 0 |
| Yr 11–30 | External tenant · 90% occ · market rent |
| Yr 31+ | External tenant · 80% occ · market rent |
| Rent growth | 2% p.a. · decays as lease shortens |
| Property tax | Tracks rent (AV-based) · flat during own-use |
| Terminal / exit value | S$0 |
Cash flow summary
Avg CF over each period. Yr 1–10 ≈ S$0/yr (BE rent covers costs). Turns positive post-loan.
| Equity invested (80% LTV) | S$93,550 |
| Avg annual CF · loan period (30 yrs) | S$1,647/yr S$137/mo |
| Avg annual CF · post-loan (11 yrs) | S$17,320/yr S$1,443/mo |
| Total cash back over 41 yrs | S$239,933 |
| Net profit / (loss) | +S$146,383 |
2.9%
IRR over 41 yrs
no exit · 2% rent p.a. · 100%/90%/80% occ by decade
no exit · 2% rent p.a. · 100%/90%/80% occ by decade
Beach Road
99LH
The Plaza
S$850,000 S$1,977 psf
430 sqft · CC5 Nicoll Highway
Agent: David Lim Wee Seng
📊 Financial Analysis · tap to collapse
📊 Financial Model
A: own-use · B: investment · both 80% LTV · 1.4% p.a. · 17% corp tax
Remaining lease
41 yrs remaining
Expires ~2067
Acquisition costs
| Purchase price | S$850,000 |
| BSD (non-residential) | S$20,100 |
| Legal fees (est.) | S$3,500 |
| ↳ Down payment (20%) + BSD + legal | S$193,600 |
| ↳ Loan (80%) | S$680,000 |
| ↳ Scenario B equity (same) | S$193,600 |
Monthly mortgage & opex
| Mgmt fee (0.70 psf/mo) | S$301 |
| Property tax (10% of AV S$28,380) | S$236 |
Rental scenarios
A · Own-use (80% LTV)
Rent covers mortgage + mgmt + property tax
S$3,163 /mo · 7.36 psf
| Mortgage (30yr @ 1.4%) | S$2,314 |
| ↳ interest / principal | S$793 / S$1,521 |
| Corp tax (17%) | S$311 |
| Net cash flow | −S$0/mo shortfall |
| Gross yield | 4.47% |
| Cap rate | 3.71% |
9.43%
equity return
cf + principal / equity in
cf + principal / equity in
vs
B · Investment (80% LTV)
Market rent 5.50 psf · equity S$193,600
S$2,365 /mo · 5.50 psf
| Mortgage (30yr @ 1.4%) | S$2,314 |
| ↳ interest / principal | S$793 / S$1,521 |
| Corp tax (17%) | S$176 |
| Net cash flow | −S$663/mo shortfall |
| Gross yield | 3.34% |
| Cap rate | 2.58% |
5.32%
equity return
cf + principal / equity in
cf + principal / equity in
A charges S$3,163/mo to own business vs market rent S$2,365/mo
(+S$798/mo vs market).
Yr1 principal paydown: S$18,252/yr (locked equity).
1.4% p.a. (midpoint of 1.2–1.6% market range) · A: own-use · B: investment · both 80% LTV ·
0.70 psf mgmt · 10% property tax on AV · 17% CIT · Non-res BSD · No ABSD.
Market rent based on zone Grade B/C comps. Not financial advice.
📉 Scenario C: Run-to-end (no exit) · tap to expand
📉 Scenario C · Leasehold Run-to-end
No exit sale · 2% rent p.a. · 80% LTV · hold 41 yrs to lease expiry
Loan paydown equity is trapped — cannot be realised without a buyer.
Returns below are purely from net rental cash flows.
Rent & occupancy assumptions
| Yr 1–10 | Company own-use · BE rent · CF ≈ 0 |
| Yr 11–30 | External tenant · 90% occ · market rent |
| Yr 31+ | External tenant · 80% occ · market rent |
| Rent growth | 2% p.a. · decays as lease shortens |
| Property tax | Tracks rent (AV-based) · flat during own-use |
| Terminal / exit value | S$0 |
Cash flow summary
Avg CF over each period. Yr 1–10 ≈ S$0/yr (BE rent covers costs). Turns positive post-loan.
| Equity invested (80% LTV) | S$193,600 |
| Avg annual CF · loan period (30 yrs) | S$-2,022/yr S$-169/mo |
| Avg annual CF · post-loan (11 yrs) | S$26,599/yr S$2,217/mo |
| Total cash back over 41 yrs | S$231,926 |
| Net profit / (loss) | +S$38,326 |
0.4%
IRR over 41 yrs
no exit · 2% rent p.a. · 100%/90%/80% occ by decade
no exit · 2% rent p.a. · 100%/90%/80% occ by decade
📊 Financial Analysis · tap to collapse
📊 Financial Model
A: own-use · B: investment · both 80% LTV · 1.4% p.a. · 17% corp tax
Remaining lease
41 yrs remaining
Expires ~2067
Acquisition costs
| Purchase price | S$598,000 |
| BSD (non-residential) | S$12,540 |
| Legal fees (est.) | S$3,500 |
| ↳ Down payment (20%) + BSD + legal | S$135,640 |
| ↳ Loan (80%) | S$478,400 |
| ↳ Scenario B equity (same) | S$135,640 |
Monthly mortgage & opex
| Mgmt fee (0.70 psf/mo) | S$211 |
| Property tax (10% of AV S$19,932) | S$166 |
Rental scenarios
A · Own-use (80% LTV)
Rent covers mortgage + mgmt + property tax
S$2,225 /mo · 7.37 psf
| Mortgage (30yr @ 1.4%) | S$1,628 |
| ↳ interest / principal | S$558 / S$1,070 |
| Corp tax (17%) | S$219 |
| Net cash flow | +S$0/mo surplus |
| Gross yield | 4.46% |
| Cap rate | 3.71% |
9.47%
equity return
cf + principal / equity in
cf + principal / equity in
vs
B · Investment (80% LTV)
Market rent 5.50 psf · equity S$135,640
S$1,661 /mo · 5.50 psf
| Mortgage (30yr @ 1.4%) | S$1,628 |
| ↳ interest / principal | S$558 / S$1,070 |
| Corp tax (17%) | S$123 |
| Net cash flow | −S$468/mo shortfall |
| Gross yield | 3.33% |
| Cap rate | 2.58% |
5.33%
equity return
cf + principal / equity in
cf + principal / equity in
A charges S$2,225/mo to own business vs market rent S$1,661/mo
(+S$564/mo vs market).
Yr1 principal paydown: S$12,841/yr (locked equity).
1.4% p.a. (midpoint of 1.2–1.6% market range) · A: own-use · B: investment · both 80% LTV ·
0.70 psf mgmt · 10% property tax on AV · 17% CIT · Non-res BSD · No ABSD.
Market rent based on zone Grade B/C comps. Not financial advice.
📉 Scenario C: Run-to-end (no exit) · tap to expand
📉 Scenario C · Leasehold Run-to-end
No exit sale · 2% rent p.a. · 80% LTV · hold 41 yrs to lease expiry
Loan paydown equity is trapped — cannot be realised without a buyer.
Returns below are purely from net rental cash flows.
Rent & occupancy assumptions
| Yr 1–10 | Company own-use · BE rent · CF ≈ 0 |
| Yr 11–30 | External tenant · 90% occ · market rent |
| Yr 31+ | External tenant · 80% occ · market rent |
| Rent growth | 2% p.a. · decays as lease shortens |
| Property tax | Tracks rent (AV-based) · flat during own-use |
| Terminal / exit value | S$0 |
Cash flow summary
Avg CF over each period. Yr 1–10 ≈ S$0/yr (BE rent covers costs). Turns positive post-loan.
| Equity invested (80% LTV) | S$135,640 |
| Avg annual CF · loan period (30 yrs) | S$-1,441/yr S$-120/mo |
| Avg annual CF · post-loan (11 yrs) | S$18,681/yr S$1,557/mo |
| Total cash back over 41 yrs | S$162,269 |
| Net profit / (loss) | +S$26,629 |
0.4%
IRR over 41 yrs
no exit · 2% rent p.a. · 100%/90%/80% occ by decade
no exit · 2% rent p.a. · 100%/90%/80% occ by decade
📊 Financial Analysis · tap to collapse
📊 Financial Model
A: own-use · B: investment · both 80% LTV · 1.4% p.a. · 17% corp tax
Remaining lease
41 yrs remaining
Expires ~2067
Acquisition costs
| Purchase price | S$720,000 |
| BSD (non-residential) | S$16,200 |
| Legal fees (est.) | S$3,500 |
| ↳ Down payment (20%) + BSD + legal | S$163,700 |
| ↳ Loan (80%) | S$576,000 |
| ↳ Scenario B equity (same) | S$163,700 |
Monthly mortgage & opex
| Mgmt fee (0.70 psf/mo) | S$309 |
| Property tax (10% of AV S$29,106) | S$243 |
Rental scenarios
A · Own-use (80% LTV)
Rent covers mortgage + mgmt + property tax
S$2,776 /mo · 6.29 psf
| Mortgage (30yr @ 1.4%) | S$1,960 |
| ↳ interest / principal | S$672 / S$1,288 |
| Corp tax (17%) | S$264 |
| Net cash flow | +S$0/mo surplus |
| Gross yield | 4.63% |
| Cap rate | 3.71% |
9.45%
equity return
cf + principal / equity in
cf + principal / equity in
vs
B · Investment (80% LTV)
Market rent 5.50 psf · equity S$163,700
S$2,426 /mo · 5.50 psf
| Mortgage (30yr @ 1.4%) | S$1,960 |
| ↳ interest / principal | S$672 / S$1,288 |
| Corp tax (17%) | S$204 |
| Net cash flow | −S$290/mo shortfall |
| Gross yield | 4.04% |
| Cap rate | 3.12% |
7.32%
equity return
cf + principal / equity in
cf + principal / equity in
A charges S$2,776/mo to own business vs market rent S$2,426/mo
(+S$350/mo vs market).
Yr1 principal paydown: S$15,460/yr (locked equity).
1.4% p.a. (midpoint of 1.2–1.6% market range) · A: own-use · B: investment · both 80% LTV ·
0.70 psf mgmt · 10% property tax on AV · 17% CIT · Non-res BSD · No ABSD.
Market rent based on zone Grade B/C comps. Not financial advice.
📉 Scenario C: Run-to-end (no exit) · tap to expand
📉 Scenario C · Leasehold Run-to-end
No exit sale · 2% rent p.a. · 80% LTV · hold 41 yrs to lease expiry
Loan paydown equity is trapped — cannot be realised without a buyer.
Returns below are purely from net rental cash flows.
Rent & occupancy assumptions
| Yr 1–10 | Company own-use · BE rent · CF ≈ 0 |
| Yr 11–30 | External tenant · 90% occ · market rent |
| Yr 31+ | External tenant · 80% occ · market rent |
| Rent growth | 2% p.a. · decays as lease shortens |
| Property tax | Tracks rent (AV-based) · flat during own-use |
| Terminal / exit value | S$0 |
Cash flow summary
Avg CF over each period. Yr 1–10 ≈ S$0/yr (BE rent covers costs). Turns positive post-loan.
| Equity invested (80% LTV) | S$163,700 |
| Avg annual CF · loan period (30 yrs) | S$1,176/yr S$98/mo |
| Avg annual CF · post-loan (11 yrs) | S$27,279/yr S$2,273/mo |
| Total cash back over 41 yrs | S$335,344 |
| Net profit / (loss) | +S$171,644 |
2.1%
IRR over 41 yrs
no exit · 2% rent p.a. · 100%/90%/80% occ by decade
no exit · 2% rent p.a. · 100%/90%/80% occ by decade
📊 Financial Analysis · tap to collapse
📊 Financial Model
A: own-use · B: investment · both 80% LTV · 1.4% p.a. · 17% corp tax
Remaining lease
41 yrs remaining
Expires ~2067
Acquisition costs
| Purchase price | S$628,000 |
| BSD (non-residential) | S$13,440 |
| Legal fees (est.) | S$3,500 |
| ↳ Down payment (20%) + BSD + legal | S$142,540 |
| ↳ Loan (80%) | S$502,400 |
| ↳ Scenario B equity (same) | S$142,540 |
Monthly mortgage & opex
| Mgmt fee (0.70 psf/mo) | S$218 |
| Property tax (10% of AV S$20,592) | S$172 |
Rental scenarios
A · Own-use (80% LTV)
Rent covers mortgage + mgmt + property tax
S$2,330 /mo · 7.47 psf
| Mortgage (30yr @ 1.4%) | S$1,710 |
| ↳ interest / principal | S$586 / S$1,124 |
| Corp tax (17%) | S$230 |
| Net cash flow | −S$0/mo shortfall |
| Gross yield | 4.45% |
| Cap rate | 3.71% |
9.46%
equity return
cf + principal / equity in
cf + principal / equity in
vs
B · Investment (80% LTV)
Market rent 5.50 psf · equity S$142,540
S$1,716 /mo · 5.50 psf
| Mortgage (30yr @ 1.4%) | S$1,710 |
| ↳ interest / principal | S$586 / S$1,124 |
| Corp tax (17%) | S$126 |
| Net cash flow | −S$510/mo shortfall |
| Gross yield | 3.28% |
| Cap rate | 2.53% |
5.17%
equity return
cf + principal / equity in
cf + principal / equity in
A charges S$2,330/mo to own business vs market rent S$1,716/mo
(+S$614/mo vs market).
Yr1 principal paydown: S$13,485/yr (locked equity).
1.4% p.a. (midpoint of 1.2–1.6% market range) · A: own-use · B: investment · both 80% LTV ·
0.70 psf mgmt · 10% property tax on AV · 17% CIT · Non-res BSD · No ABSD.
Market rent based on zone Grade B/C comps. Not financial advice.
📉 Scenario C: Run-to-end (no exit) · tap to expand
📉 Scenario C · Leasehold Run-to-end
No exit sale · 2% rent p.a. · 80% LTV · hold 41 yrs to lease expiry
Loan paydown equity is trapped — cannot be realised without a buyer.
Returns below are purely from net rental cash flows.
Rent & occupancy assumptions
| Yr 1–10 | Company own-use · BE rent · CF ≈ 0 |
| Yr 11–30 | External tenant · 90% occ · market rent |
| Yr 31+ | External tenant · 80% occ · market rent |
| Rent growth | 2% p.a. · decays as lease shortens |
| Property tax | Tracks rent (AV-based) · flat during own-use |
| Terminal / exit value | S$0 |
Cash flow summary
Avg CF over each period. Yr 1–10 ≈ S$0/yr (BE rent covers costs). Turns positive post-loan.
| Equity invested (80% LTV) | S$142,540 |
| Avg annual CF · loan period (30 yrs) | S$-1,707/yr S$-142/mo |
| Avg annual CF · post-loan (11 yrs) | S$19,300/yr S$1,608/mo |
| Total cash back over 41 yrs | S$161,078 |
| Net profit / (loss) | +S$18,538 |
0.3%
IRR over 41 yrs
no exit · 2% rent p.a. · 100%/90%/80% occ by decade
no exit · 2% rent p.a. · 100%/90%/80% occ by decade
📊 Financial Analysis · tap to collapse
📊 Financial Model
A: own-use · B: investment · both 80% LTV · 1.4% p.a. · 17% corp tax
Remaining lease
41 yrs remaining
Expires ~2067
Acquisition costs
| Purchase price | S$700,000 |
| BSD (non-residential) | S$15,600 |
| Legal fees (est.) | S$3,500 |
| ↳ Down payment (20%) + BSD + legal | S$159,100 |
| ↳ Loan (80%) | S$560,000 |
| ↳ Scenario B equity (same) | S$159,100 |
Monthly mortgage & opex
| Mgmt fee (0.70 psf/mo) | S$302 |
| Property tax (10% of AV S$28,446) | S$237 |
Rental scenarios
A · Own-use (80% LTV)
Rent covers mortgage + mgmt + property tax
S$2,701 /mo · 6.27 psf
| Mortgage (30yr @ 1.4%) | S$1,906 |
| ↳ interest / principal | S$653 / S$1,253 |
| Corp tax (17%) | S$257 |
| Net cash flow | −S$0/mo shortfall |
| Gross yield | 4.63% |
| Cap rate | 3.71% |
9.45%
equity return
cf + principal / equity in
cf + principal / equity in
vs
B · Investment (80% LTV)
Market rent 5.50 psf · equity S$159,100
S$2,370 /mo · 5.50 psf
| Mortgage (30yr @ 1.4%) | S$1,906 |
| ↳ interest / principal | S$653 / S$1,253 |
| Corp tax (17%) | S$200 |
| Net cash flow | −S$275/mo shortfall |
| Gross yield | 4.06% |
| Cap rate | 3.14% |
7.37%
equity return
cf + principal / equity in
cf + principal / equity in
A charges S$2,701/mo to own business vs market rent S$2,370/mo
(+S$331/mo vs market).
Yr1 principal paydown: S$15,031/yr (locked equity).
1.4% p.a. (midpoint of 1.2–1.6% market range) · A: own-use · B: investment · both 80% LTV ·
0.70 psf mgmt · 10% property tax on AV · 17% CIT · Non-res BSD · No ABSD.
Market rent based on zone Grade B/C comps. Not financial advice.
📉 Scenario C: Run-to-end (no exit) · tap to expand
📉 Scenario C · Leasehold Run-to-end
No exit sale · 2% rent p.a. · 80% LTV · hold 41 yrs to lease expiry
Loan paydown equity is trapped — cannot be realised without a buyer.
Returns below are purely from net rental cash flows.
Rent & occupancy assumptions
| Yr 1–10 | Company own-use · BE rent · CF ≈ 0 |
| Yr 11–30 | External tenant · 90% occ · market rent |
| Yr 31+ | External tenant · 80% occ · market rent |
| Rent growth | 2% p.a. · decays as lease shortens |
| Property tax | Tracks rent (AV-based) · flat during own-use |
| Terminal / exit value | S$0 |
Cash flow summary
Avg CF over each period. Yr 1–10 ≈ S$0/yr (BE rent covers costs). Turns positive post-loan.
| Equity invested (80% LTV) | S$159,100 |
| Avg annual CF · loan period (30 yrs) | S$1,225/yr S$102/mo |
| Avg annual CF · post-loan (11 yrs) | S$26,661/yr S$2,222/mo |
| Total cash back over 41 yrs | S$330,028 |
| Net profit / (loss) | +S$170,928 |
2.1%
IRR over 41 yrs
no exit · 2% rent p.a. · 100%/90%/80% occ by decade
no exit · 2% rent p.a. · 100%/90%/80% occ by decade
Beach Road
99LH
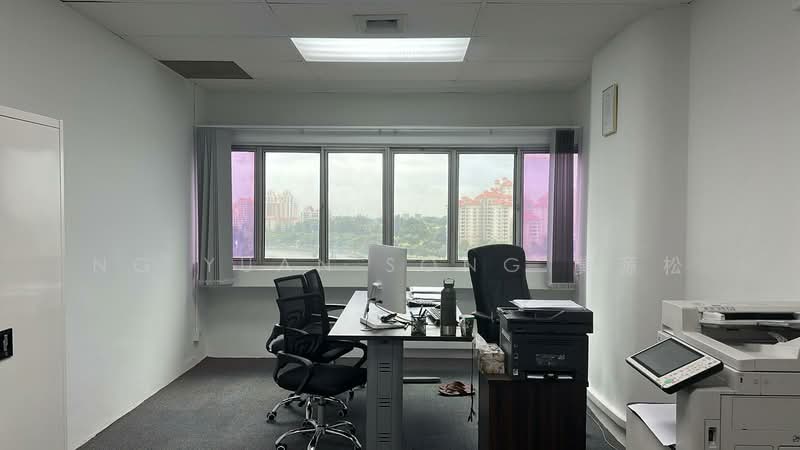
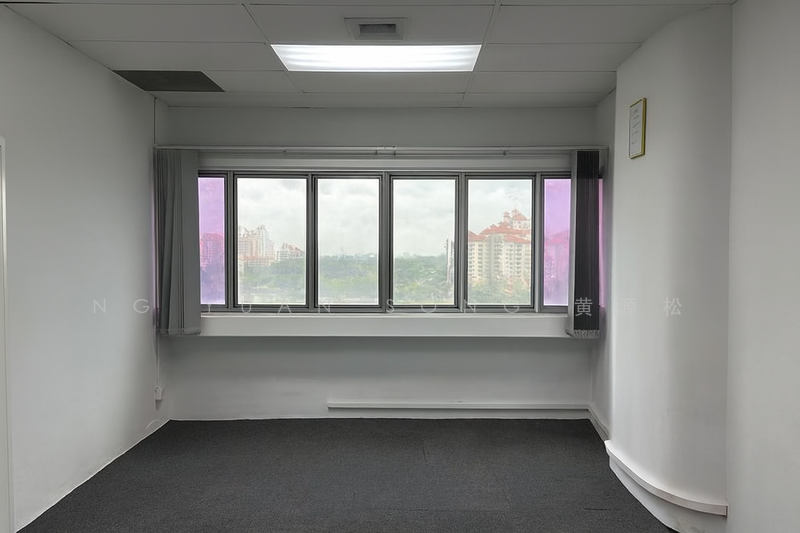
Golden Mile Tower
S$780,000 S$1,685 psf
463 sqft · CC5 Nicoll Highway
Agent: Ng Yuan Song 黄源松
📊 Financial Analysis · tap to collapse
📊 Financial Model
A: own-use · B: investment · both 80% LTV · 1.4% p.a. · 17% corp tax
Remaining lease
44 yrs remaining
Expires ~2070
Acquisition costs
| Purchase price | S$780,000 |
| BSD (non-residential) | S$18,000 |
| Legal fees (est.) | S$3,500 |
| ↳ Down payment (20%) + BSD + legal | S$177,500 |
| ↳ Loan (80%) | S$624,000 |
| ↳ Scenario B equity (same) | S$177,500 |
Monthly mortgage & opex
| Mgmt fee (0.70 psf/mo) | S$324 |
| Property tax (10% of AV S$30,558) | S$255 |
Rental scenarios
A · Own-use (80% LTV)
Rent covers mortgage + mgmt + property tax
S$2,988 /mo · 6.45 psf
| Mortgage (30yr @ 1.4%) | S$2,124 |
| ↳ interest / principal | S$728 / S$1,396 |
| Corp tax (17%) | S$286 |
| Net cash flow | −S$0/mo shortfall |
| Gross yield | 4.60% |
| Cap rate | 3.71% |
9.43%
equity return
cf + principal / equity in
cf + principal / equity in
vs
B · Investment (80% LTV)
Market rent 5.50 psf · equity S$177,500
S$2,546 /mo · 5.50 psf
| Mortgage (30yr @ 1.4%) | S$2,124 |
| ↳ interest / principal | S$728 / S$1,396 |
| Corp tax (17%) | S$211 |
| Net cash flow | −S$367/mo shortfall |
| Gross yield | 3.92% |
| Cap rate | 3.03% |
6.95%
equity return
cf + principal / equity in
cf + principal / equity in
A charges S$2,988/mo to own business vs market rent S$2,546/mo
(+S$442/mo vs market).
Yr1 principal paydown: S$16,749/yr (locked equity).
1.4% p.a. (midpoint of 1.2–1.6% market range) · A: own-use · B: investment · both 80% LTV ·
0.70 psf mgmt · 10% property tax on AV · 17% CIT · Non-res BSD · No ABSD.
Market rent based on zone Grade B/C comps. Not financial advice.
📉 Scenario C: Run-to-end (no exit) · tap to expand
📉 Scenario C · Leasehold Run-to-end
No exit sale · 2% rent p.a. · 80% LTV · hold 44 yrs to lease expiry
Loan paydown equity is trapped — cannot be realised without a buyer.
Returns below are purely from net rental cash flows.
Rent & occupancy assumptions
| Yr 1–10 | Company own-use · BE rent · CF ≈ 0 |
| Yr 11–30 | External tenant · 90% occ · market rent |
| Yr 31+ | External tenant · 80% occ · market rent |
| Rent growth | 2% p.a. · decays as lease shortens |
| Property tax | Tracks rent (AV-based) · flat during own-use |
| Terminal / exit value | S$0 |
Cash flow summary
Avg CF over each period. Yr 1–10 ≈ S$0/yr (BE rent covers costs). Turns positive post-loan.
| Equity invested (80% LTV) | S$177,500 |
| Avg annual CF · loan period (30 yrs) | S$885/yr S$74/mo |
| Avg annual CF · post-loan (14 yrs) | S$30,004/yr S$2,500/mo |
| Total cash back over 44 yrs | S$446,591 |
| Net profit / (loss) | +S$269,091 |
2.5%
IRR over 44 yrs
no exit · 2% rent p.a. · 100%/90%/80% occ by decade
no exit · 2% rent p.a. · 100%/90%/80% occ by decade
📊 Financial Analysis · tap to collapse
📊 Financial Model
A: own-use · B: investment · both 80% LTV · 1.4% p.a. · 17% corp tax
Remaining lease
41 yrs remaining
Expires ~2067
Acquisition costs
| Purchase price | S$688,000 |
| BSD (non-residential) | S$15,240 |
| Legal fees (est.) | S$3,500 |
| ↳ Down payment (20%) + BSD + legal | S$156,340 |
| ↳ Loan (80%) | S$550,400 |
| ↳ Scenario B equity (same) | S$156,340 |
Monthly mortgage & opex
| Mgmt fee (0.70 psf/mo) | S$279 |
| Property tax (10% of AV S$26,268) | S$219 |
Rental scenarios
A · Own-use (80% LTV)
Rent covers mortgage + mgmt + property tax
S$2,623 /mo · 6.59 psf
| Mortgage (30yr @ 1.4%) | S$1,873 |
| ↳ interest / principal | S$642 / S$1,231 |
| Corp tax (17%) | S$252 |
| Net cash flow | +S$0/mo surplus |
| Gross yield | 4.58% |
| Cap rate | 3.71% |
9.45%
equity return
cf + principal / equity in
cf + principal / equity in
vs
B · Investment (80% LTV)
Market rent 5.50 psf · equity S$156,340
S$2,189 /mo · 5.50 psf
| Mortgage (30yr @ 1.4%) | S$1,873 |
| ↳ interest / principal | S$642 / S$1,231 |
| Corp tax (17%) | S$178 |
| Net cash flow | −S$360/mo shortfall |
| Gross yield | 3.82% |
| Cap rate | 2.95% |
6.69%
equity return
cf + principal / equity in
cf + principal / equity in
A charges S$2,623/mo to own business vs market rent S$2,189/mo
(+S$434/mo vs market).
Yr1 principal paydown: S$14,773/yr (locked equity).
1.4% p.a. (midpoint of 1.2–1.6% market range) · A: own-use · B: investment · both 80% LTV ·
0.70 psf mgmt · 10% property tax on AV · 17% CIT · Non-res BSD · No ABSD.
Market rent based on zone Grade B/C comps. Not financial advice.
📉 Scenario C: Run-to-end (no exit) · tap to expand
📉 Scenario C · Leasehold Run-to-end
No exit sale · 2% rent p.a. · 80% LTV · hold 41 yrs to lease expiry
Loan paydown equity is trapped — cannot be realised without a buyer.
Returns below are purely from net rental cash flows.
Rent & occupancy assumptions
| Yr 1–10 | Company own-use · BE rent · CF ≈ 0 |
| Yr 11–30 | External tenant · 90% occ · market rent |
| Yr 31+ | External tenant · 80% occ · market rent |
| Rent growth | 2% p.a. · decays as lease shortens |
| Property tax | Tracks rent (AV-based) · flat during own-use |
| Terminal / exit value | S$0 |
Cash flow summary
Avg CF over each period. Yr 1–10 ≈ S$0/yr (BE rent covers costs). Turns positive post-loan.
| Equity invested (80% LTV) | S$156,340 |
| Avg annual CF · loan period (30 yrs) | S$243/yr S$20/mo |
| Avg annual CF · post-loan (11 yrs) | S$24,619/yr S$2,052/mo |
| Total cash back over 41 yrs | S$278,090 |
| Net profit / (loss) | +S$121,750 |
1.6%
IRR over 41 yrs
no exit · 2% rent p.a. · 100%/90%/80% occ by decade
no exit · 2% rent p.a. · 100%/90%/80% occ by decade
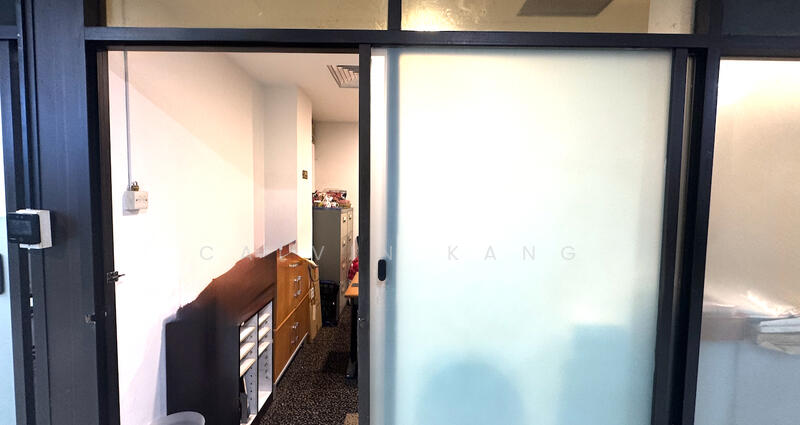
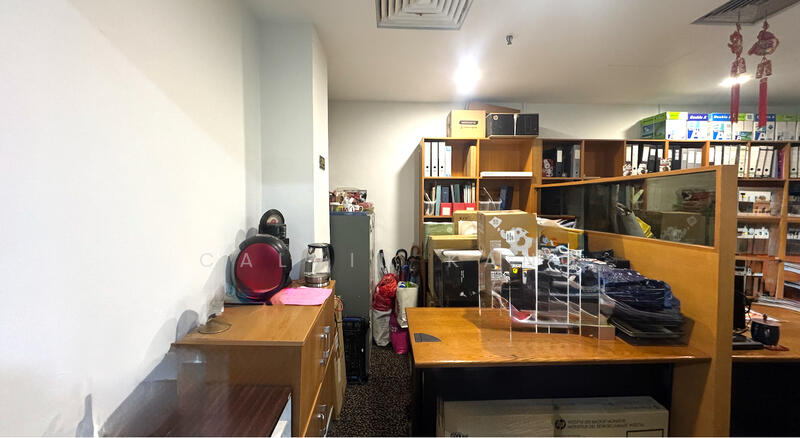
Orchard
99LH
Orchard Plaza
S$488,000 S$2,515 psf
194 sqft · NS23 Somerset MRT Station
Agent: Calvin Kang
📊 Financial Analysis · tap to collapse
📊 Financial Model
A: own-use · B: investment · both 80% LTV · 1.4% p.a. · 17% corp tax
Remaining lease
43 yrs remaining
Expires ~2069
Acquisition costs
| Purchase price | S$488,000 |
| BSD (non-residential) | S$9,240 |
| Legal fees (est.) | S$3,500 |
| ↳ Down payment (20%) + BSD + legal | S$110,340 |
| ↳ Loan (80%) | S$390,400 |
| ↳ Scenario B equity (same) | S$110,340 |
Monthly mortgage & opex
| Mgmt fee (0.90 psf/mo) | S$175 |
| Property tax (10% of AV S$15,132) | S$126 |
Rental scenarios
A · Own-use (80% LTV)
Rent covers mortgage + mgmt + property tax
S$1,808 /mo · 9.32 psf
| Mortgage (30yr @ 1.4%) | S$1,329 |
| ↳ interest / principal | S$455 / S$873 |
| Corp tax (17%) | S$179 |
| Net cash flow | −S$0/mo shortfall |
| Gross yield | 4.45% |
| Cap rate | 3.71% |
9.49%
equity return
cf + principal / equity in
cf + principal / equity in
vs
B · Investment (80% LTV)
Market rent 6.50 psf · equity S$110,340
S$1,261 /mo · 6.50 psf
| Mortgage (30yr @ 1.4%) | S$1,329 |
| ↳ interest / principal | S$455 / S$873 |
| Corp tax (17%) | S$86 |
| Net cash flow | −S$454/mo shortfall |
| Gross yield | 3.10% |
| Cap rate | 2.36% |
4.56%
equity return
cf + principal / equity in
cf + principal / equity in
A charges S$1,808/mo to own business vs market rent S$1,261/mo
(+S$547/mo vs market).
Yr1 principal paydown: S$10,479/yr (locked equity).
1.4% p.a. (midpoint of 1.2–1.6% market range) · A: own-use · B: investment · both 80% LTV ·
0.90 psf mgmt · 10% property tax on AV · 17% CIT · Non-res BSD · No ABSD.
Market rent based on zone Grade B/C comps. Not financial advice.
📉 Scenario C: Run-to-end (no exit) · tap to expand
📉 Scenario C · Leasehold Run-to-end
No exit sale · 2% rent p.a. · 80% LTV · hold 43 yrs to lease expiry
Loan paydown equity is trapped — cannot be realised without a buyer.
Returns below are purely from net rental cash flows.
Rent & occupancy assumptions
| Yr 1–10 | Company own-use · BE rent · CF ≈ 0 |
| Yr 11–30 | External tenant · 90% occ · market rent |
| Yr 31+ | External tenant · 80% occ · market rent |
| Rent growth | 2% p.a. · decays as lease shortens |
| Property tax | Tracks rent (AV-based) · flat during own-use |
| Terminal / exit value | S$0 |
Cash flow summary
Avg CF over each period. Yr 1–10 ≈ S$0/yr (BE rent covers costs). Turns positive post-loan.
| Equity invested (80% LTV) | S$110,340 |
| Avg annual CF · loan period (30 yrs) | S$-1,858/yr S$-155/mo |
| Avg annual CF · post-loan (13 yrs) | S$14,492/yr S$1,208/mo |
| Total cash back over 43 yrs | S$132,642 |
| Net profit / (loss) | +S$22,302 |
0.4%
IRR over 43 yrs
no exit · 2% rent p.a. · 100%/90%/80% occ by decade
no exit · 2% rent p.a. · 100%/90%/80% occ by decade
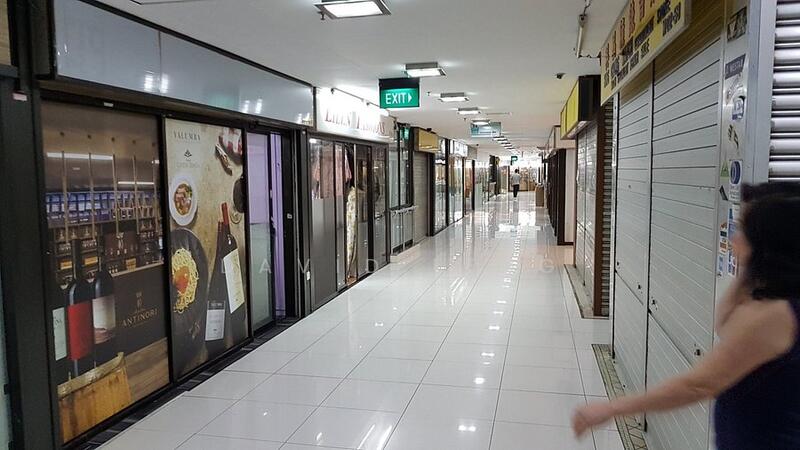
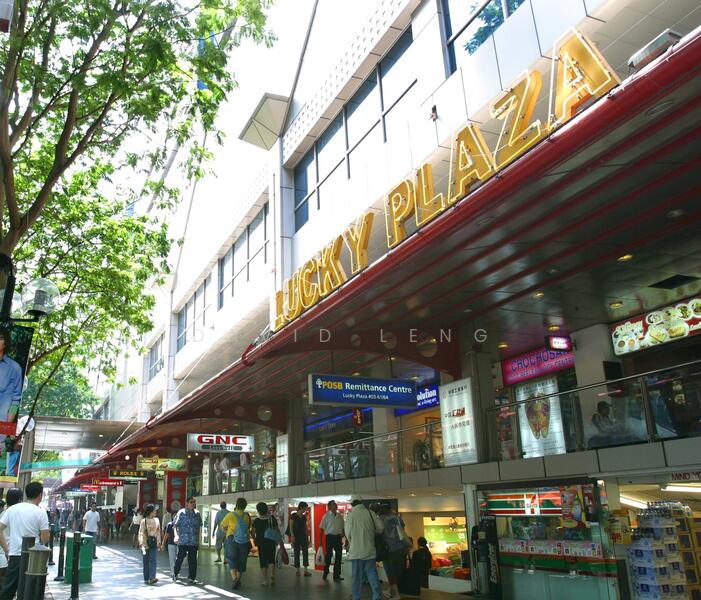
Orchard
99LH
Orchard Plaza
S$835,000 S$1,847 psf
452 sqft · NS23 Somerset MRT Station
Agent: David Leng
📊 Financial Analysis · tap to collapse
📊 Financial Model
A: own-use · B: investment · both 80% LTV · 1.4% p.a. · 17% corp tax
Remaining lease
43 yrs remaining
Expires ~2069
Acquisition costs
| Purchase price | S$835,000 |
| BSD (non-residential) | S$19,650 |
| Legal fees (est.) | S$3,500 |
| ↳ Down payment (20%) + BSD + legal | S$190,150 |
| ↳ Loan (80%) | S$668,000 |
| ↳ Scenario B equity (same) | S$190,150 |
Monthly mortgage & opex
| Mgmt fee (0.90 psf/mo) | S$407 |
| Property tax (10% of AV S$35,256) | S$294 |
Rental scenarios
A · Own-use (80% LTV)
Rent covers mortgage + mgmt + property tax
S$3,280 /mo · 7.26 psf
| Mortgage (30yr @ 1.4%) | S$2,273 |
| ↳ interest / principal | S$779 / S$1,494 |
| Corp tax (17%) | S$306 |
| Net cash flow | −S$0/mo shortfall |
| Gross yield | 4.71% |
| Cap rate | 3.71% |
9.43%
equity return
cf + principal / equity in
cf + principal / equity in
vs
B · Investment (80% LTV)
Market rent 6.50 psf · equity S$190,150
S$2,938 /mo · 6.50 psf
| Mortgage (30yr @ 1.4%) | S$2,273 |
| ↳ interest / principal | S$779 / S$1,494 |
| Corp tax (17%) | S$248 |
| Net cash flow | −S$284/mo shortfall |
| Gross yield | 4.22% |
| Cap rate | 3.22% |
7.64%
equity return
cf + principal / equity in
cf + principal / equity in
A charges S$3,280/mo to own business vs market rent S$2,938/mo
(+S$342/mo vs market).
Yr1 principal paydown: S$17,930/yr (locked equity).
1.4% p.a. (midpoint of 1.2–1.6% market range) · A: own-use · B: investment · both 80% LTV ·
0.90 psf mgmt · 10% property tax on AV · 17% CIT · Non-res BSD · No ABSD.
Market rent based on zone Grade B/C comps. Not financial advice.
📉 Scenario C: Run-to-end (no exit) · tap to expand
📉 Scenario C · Leasehold Run-to-end
No exit sale · 2% rent p.a. · 80% LTV · hold 43 yrs to lease expiry
Loan paydown equity is trapped — cannot be realised without a buyer.
Returns below are purely from net rental cash flows.
Rent & occupancy assumptions
| Yr 1–10 | Company own-use · BE rent · CF ≈ 0 |
| Yr 11–30 | External tenant · 90% occ · market rent |
| Yr 31+ | External tenant · 80% occ · market rent |
| Rent growth | 2% p.a. · decays as lease shortens |
| Property tax | Tracks rent (AV-based) · flat during own-use |
| Terminal / exit value | S$0 |
Cash flow summary
Avg CF over each period. Yr 1–10 ≈ S$0/yr (BE rent covers costs). Turns positive post-loan.
| Equity invested (80% LTV) | S$190,150 |
| Avg annual CF · loan period (30 yrs) | S$2,133/yr S$178/mo |
| Avg annual CF · post-loan (13 yrs) | S$33,765/yr S$2,814/mo |
| Total cash back over 43 yrs | S$502,925 |
| Net profit / (loss) | +S$312,775 |
2.8%
IRR over 43 yrs
no exit · 2% rent p.a. · 100%/90%/80% occ by decade
no exit · 2% rent p.a. · 100%/90%/80% occ by decade
Orchard
FH
Orchard Towers
S$1,093,888 S$2,748 psf
398 sqft · NS22 Orchard MRT Station
Agent: Victor Koh
📊 Financial Analysis · tap to collapse
📊 Financial Model
A: own-use · B: investment · both 80% LTV · 1.4% p.a. · 17% corp tax
Remaining lease
Freehold / 999-yr
No expiry
Acquisition costs
| Purchase price | S$1,093,888 |
| BSD (non-residential) | S$28,356 |
| Legal fees (est.) | S$3,500 |
| ↳ Down payment (20%) + BSD + legal | S$250,634 |
| ↳ Loan (80%) | S$875,110 |
| ↳ Scenario B equity (same) | S$250,634 |
Monthly mortgage & opex
| Mgmt fee (0.90 psf/mo) | S$358 |
| Property tax (10% of AV S$31,044) | S$259 |
Rental scenarios
A · Own-use (80% LTV)
Rent covers mortgage + mgmt + property tax
S$3,996 /mo · 10.04 psf
| Mortgage (30yr @ 1.4%) | S$2,978 |
| ↳ interest / principal | S$1,021 / S$1,957 |
| Corp tax (17%) | S$401 |
| Net cash flow | −S$0/mo shortfall |
| Gross yield | 4.38% |
| Cap rate | 3.71% |
9.37%
equity return
cf + principal / equity in
cf + principal / equity in
vs
B · Investment (80% LTV)
Market rent 6.50 psf · equity S$250,634
S$2,587 /mo · 6.50 psf
| Mortgage (30yr @ 1.4%) | S$2,978 |
| ↳ interest / principal | S$1,021 / S$1,957 |
| Corp tax (17%) | S$161 |
| Net cash flow | −S$1,170/mo shortfall |
| Gross yield | 2.84% |
| Cap rate | 2.16% |
3.77%
equity return
cf + principal / equity in
cf + principal / equity in
A charges S$3,996/mo to own business vs market rent S$2,587/mo
(+S$1,409/mo vs market).
Yr1 principal paydown: S$23,489/yr (locked equity).
1.4% p.a. (midpoint of 1.2–1.6% market range) · A: own-use · B: investment · both 80% LTV ·
0.90 psf mgmt · 10% property tax on AV · 17% CIT · Non-res BSD · No ABSD.
Market rent based on zone Grade B/C comps. Not financial advice.
City Hall
999LH
High Street Plaza
S$888,000 S$2,171 psf
409 sqft · NS25 City Hall MRT Station
Agent: Jagjot Singh
📊 Financial Analysis · tap to collapse
📊 Financial Model
A: own-use · B: investment · both 80% LTV · 1.4% p.a. · 17% corp tax
Remaining lease
Freehold / 999-yr
Expires ~2969
Acquisition costs
| Purchase price | S$888,000 |
| BSD (non-residential) | S$21,240 |
| Legal fees (est.) | S$3,500 |
| ↳ Down payment (20%) + BSD + legal | S$202,340 |
| ↳ Loan (80%) | S$710,400 |
| ↳ Scenario B equity (same) | S$202,340 |
Monthly mortgage & opex
| Mgmt fee (0.80 psf/mo) | S$327 |
| Property tax (10% of AV S$29,448) | S$245 |
Rental scenarios
A · Own-use (80% LTV)
Rent covers mortgage + mgmt + property tax
S$3,316 /mo · 8.11 psf
| Mortgage (30yr @ 1.4%) | S$2,418 |
| ↳ interest / principal | S$829 / S$1,589 |
| Corp tax (17%) | S$325 |
| Net cash flow | +S$0/mo surplus |
| Gross yield | 4.48% |
| Cap rate | 3.71% |
9.42%
equity return
cf + principal / equity in
cf + principal / equity in
vs
B · Investment (80% LTV)
Market rent 6.00 psf · equity S$202,340
S$2,454 /mo · 6.00 psf
| Mortgage (30yr @ 1.4%) | S$2,418 |
| ↳ interest / principal | S$829 / S$1,589 |
| Corp tax (17%) | S$179 |
| Net cash flow | −S$715/mo shortfall |
| Gross yield | 3.32% |
| Cap rate | 2.54% |
5.18%
equity return
cf + principal / equity in
cf + principal / equity in
A charges S$3,316/mo to own business vs market rent S$2,454/mo
(+S$862/mo vs market).
Yr1 principal paydown: S$19,068/yr (locked equity).
1.4% p.a. (midpoint of 1.2–1.6% market range) · A: own-use · B: investment · both 80% LTV ·
0.80 psf mgmt · 10% property tax on AV · 17% CIT · Non-res BSD · No ABSD.
Market rent based on zone Grade B/C comps. Not financial advice.


City Hall
LH
High Street Centre
S$460,000 S$1,855 psf
248 sqft · NE5 Clarke Quay MRT Station
Agent: Jagjot Singh
📊 Financial Analysis · tap to collapse
📊 Financial Model
A: own-use · B: investment · both 80% LTV · 1.4% p.a. · 17% corp tax
Remaining lease
50 yrs remaining
Expires ~2076
Acquisition costs
| Purchase price | S$460,000 |
| BSD (non-residential) | S$8,400 |
| Legal fees (est.) | S$3,500 |
| ↳ Down payment (20%) + BSD + legal | S$103,900 |
| ↳ Loan (80%) | S$368,000 |
| ↳ Scenario B equity (same) | S$103,900 |
Monthly mortgage & opex
| Mgmt fee (0.80 psf/mo) | S$198 |
| Property tax (10% of AV S$17,856) | S$149 |
Rental scenarios
A · Own-use (80% LTV)
Rent covers mortgage + mgmt + property tax
S$1,768 /mo · 7.13 psf
| Mortgage (30yr @ 1.4%) | S$1,252 |
| ↳ interest / principal | S$429 / S$823 |
| Corp tax (17%) | S$169 |
| Net cash flow | −S$0/mo shortfall |
| Gross yield | 4.61% |
| Cap rate | 3.71% |
9.50%
equity return
cf + principal / equity in
cf + principal / equity in
vs
B · Investment (80% LTV)
Market rent 6.00 psf · equity S$103,900
S$1,488 /mo · 6.00 psf
| Mortgage (30yr @ 1.4%) | S$1,252 |
| ↳ interest / principal | S$429 / S$823 |
| Corp tax (17%) | S$121 |
| Net cash flow | −S$233/mo shortfall |
| Gross yield | 3.88% |
| Cap rate | 2.98% |
6.82%
equity return
cf + principal / equity in
cf + principal / equity in
A charges S$1,768/mo to own business vs market rent S$1,488/mo
(+S$280/mo vs market).
Yr1 principal paydown: S$9,878/yr (locked equity).
1.4% p.a. (midpoint of 1.2–1.6% market range) · A: own-use · B: investment · both 80% LTV ·
0.80 psf mgmt · 10% property tax on AV · 17% CIT · Non-res BSD · No ABSD.
Market rent based on zone Grade B/C comps. Not financial advice.
📉 Scenario C: Run-to-end (no exit) · tap to expand
📉 Scenario C · Leasehold Run-to-end
No exit sale · 2% rent p.a. · 80% LTV · hold 50 yrs to lease expiry
Loan paydown equity is trapped — cannot be realised without a buyer.
Returns below are purely from net rental cash flows.
Rent & occupancy assumptions
| Yr 1–10 | Company own-use · BE rent · CF ≈ 0 |
| Yr 11–30 | External tenant · 90% occ · market rent |
| Yr 31+ | External tenant · 80% occ · market rent |
| Rent growth | 2% p.a. · decays as lease shortens |
| Property tax | Tracks rent (AV-based) · flat during own-use |
| Terminal / exit value | S$0 |
Cash flow summary
Avg CF over each period. Yr 1–10 ≈ S$0/yr (BE rent covers costs). Turns positive post-loan.
| Equity invested (80% LTV) | S$103,900 |
| Avg annual CF · loan period (30 yrs) | S$487/yr S$41/mo |
| Avg annual CF · post-loan (20 yrs) | S$19,071/yr S$1,589/mo |
| Total cash back over 50 yrs | S$396,030 |
| Net profit / (loss) | +S$292,130 |
3.4%
IRR over 50 yrs
no exit · 2% rent p.a. · 100%/90%/80% occ by decade
no exit · 2% rent p.a. · 100%/90%/80% occ by decade
City Hall
LH
High Street Centre
S$730,000 S$1,655 psf
441 sqft · NE5 Clarke Quay MRT Station
Agent: Jagjot Singh
📊 Financial Analysis · tap to collapse
📊 Financial Model
A: own-use · B: investment · both 80% LTV · 1.4% p.a. · 17% corp tax
Remaining lease
50 yrs remaining
Expires ~2076
Acquisition costs
| Purchase price | S$730,000 |
| BSD (non-residential) | S$16,500 |
| Legal fees (est.) | S$3,500 |
| ↳ Down payment (20%) + BSD + legal | S$166,000 |
| ↳ Loan (80%) | S$584,000 |
| ↳ Scenario B equity (same) | S$166,000 |
Monthly mortgage & opex
| Mgmt fee (0.80 psf/mo) | S$353 |
| Property tax (10% of AV S$31,752) | S$265 |
Rental scenarios
A · Own-use (80% LTV)
Rent covers mortgage + mgmt + property tax
S$2,873 /mo · 6.51 psf
| Mortgage (30yr @ 1.4%) | S$1,988 |
| ↳ interest / principal | S$681 / S$1,306 |
| Corp tax (17%) | S$268 |
| Net cash flow | +S$0/mo surplus |
| Gross yield | 4.72% |
| Cap rate | 3.71% |
9.45%
equity return
cf + principal / equity in
cf + principal / equity in
vs
B · Investment (80% LTV)
Market rent 6.00 psf · equity S$166,000
S$2,646 /mo · 6.00 psf
| Mortgage (30yr @ 1.4%) | S$1,988 |
| ↳ interest / principal | S$681 / S$1,306 |
| Corp tax (17%) | S$229 |
| Net cash flow | −S$188/mo shortfall |
| Gross yield | 4.35% |
| Cap rate | 3.33% |
8.08%
equity return
cf + principal / equity in
cf + principal / equity in
A charges S$2,873/mo to own business vs market rent S$2,646/mo
(+S$227/mo vs market).
Yr1 principal paydown: S$15,675/yr (locked equity).
1.4% p.a. (midpoint of 1.2–1.6% market range) · A: own-use · B: investment · both 80% LTV ·
0.80 psf mgmt · 10% property tax on AV · 17% CIT · Non-res BSD · No ABSD.
Market rent based on zone Grade B/C comps. Not financial advice.
📉 Scenario C: Run-to-end (no exit) · tap to expand
📉 Scenario C · Leasehold Run-to-end
No exit sale · 2% rent p.a. · 80% LTV · hold 50 yrs to lease expiry
Loan paydown equity is trapped — cannot be realised without a buyer.
Returns below are purely from net rental cash flows.
Rent & occupancy assumptions
| Yr 1–10 | Company own-use · BE rent · CF ≈ 0 |
| Yr 11–30 | External tenant · 90% occ · market rent |
| Yr 31+ | External tenant · 80% occ · market rent |
| Rent growth | 2% p.a. · decays as lease shortens |
| Property tax | Tracks rent (AV-based) · flat during own-use |
| Terminal / exit value | S$0 |
Cash flow summary
Avg CF over each period. Yr 1–10 ≈ S$0/yr (BE rent covers costs). Turns positive post-loan.
| Equity invested (80% LTV) | S$166,000 |
| Avg annual CF · loan period (30 yrs) | S$2,751/yr S$229/mo |
| Avg annual CF · post-loan (20 yrs) | S$33,913/yr S$2,826/mo |
| Total cash back over 50 yrs | S$760,795 |
| Net profit / (loss) | +S$594,795 |
4.1%
IRR over 50 yrs
no exit · 2% rent p.a. · 100%/90%/80% occ by decade
no exit · 2% rent p.a. · 100%/90%/80% occ by decade
City Hall
999LH
High Street Plaza
S$950,000 S$2,941 psf
323 sqft · NS25 City Hall MRT Station
Agent: Jagjot Singh
1 other agent(s) listing this unit
📊 Financial Analysis · tap to collapse
📊 Financial Model
A: own-use · B: investment · both 80% LTV · 1.4% p.a. · 17% corp tax
Remaining lease
Freehold / 999-yr
Expires ~2969
Acquisition costs
| Purchase price | S$950,000 |
| BSD (non-residential) | S$23,100 |
| Legal fees (est.) | S$3,500 |
| ↳ Down payment (20%) + BSD + legal | S$216,600 |
| ↳ Loan (80%) | S$760,000 |
| ↳ Scenario B equity (same) | S$216,600 |
Monthly mortgage & opex
| Mgmt fee (0.80 psf/mo) | S$258 |
| Property tax (10% of AV S$23,256) | S$194 |
Rental scenarios
A · Own-use (80% LTV)
Rent covers mortgage + mgmt + property tax
S$3,387 /mo · 10.49 psf
| Mortgage (30yr @ 1.4%) | S$2,587 |
| ↳ interest / principal | S$887 / S$1,700 |
| Corp tax (17%) | S$348 |
| Net cash flow | +S$0/mo surplus |
| Gross yield | 4.28% |
| Cap rate | 3.71% |
9.42%
equity return
cf + principal / equity in
cf + principal / equity in
vs
B · Investment (80% LTV)
Market rent 6.00 psf · equity S$216,600
S$1,938 /mo · 6.00 psf
| Mortgage (30yr @ 1.4%) | S$2,587 |
| ↳ interest / principal | S$887 / S$1,700 |
| Corp tax (17%) | S$102 |
| Net cash flow | −S$1,203/mo shortfall |
| Gross yield | 2.45% |
| Cap rate | 1.88% |
2.76%
equity return
cf + principal / equity in
cf + principal / equity in
A charges S$3,387/mo to own business vs market rent S$1,938/mo
(+S$1,449/mo vs market).
Yr1 principal paydown: S$20,399/yr (locked equity).
1.4% p.a. (midpoint of 1.2–1.6% market range) · A: own-use · B: investment · both 80% LTV ·
0.80 psf mgmt · 10% property tax on AV · 17% CIT · Non-res BSD · No ABSD.
Market rent based on zone Grade B/C comps. Not financial advice.
Bugis
LH
Waterloo Centre
S$950,000 S$1,730 psf
549 sqft · DT21 Bencoolen MRT Station
Agent: Joseph Tan
📊 Financial Analysis · tap to collapse
📊 Financial Model
A: own-use · B: investment · both 80% LTV · 1.4% p.a. · 17% corp tax
Remaining lease
60 yrs remaining
Expires ~2086
Acquisition costs
| Purchase price | S$950,000 |
| BSD (non-residential) | S$23,100 |
| Legal fees (est.) | S$3,500 |
| ↳ Down payment (20%) + BSD + legal | S$216,600 |
| ↳ Loan (80%) | S$760,000 |
| ↳ Scenario B equity (same) | S$216,600 |
Monthly mortgage & opex
| Mgmt fee (0.70 psf/mo) | S$384 |
| Property tax (10% of AV S$36,234) | S$302 |
Rental scenarios
A · Own-use (80% LTV)
Rent covers mortgage + mgmt + property tax
S$3,621 /mo · 6.60 psf
| Mortgage (30yr @ 1.4%) | S$2,587 |
| ↳ interest / principal | S$887 / S$1,700 |
| Corp tax (17%) | S$348 |
| Net cash flow | −S$0/mo shortfall |
| Gross yield | 4.57% |
| Cap rate | 3.71% |
9.42%
equity return
cf + principal / equity in
cf + principal / equity in
vs
B · Investment (80% LTV)
Market rent 5.50 psf · equity S$216,600
S$3,020 /mo · 5.50 psf
| Mortgage (30yr @ 1.4%) | S$2,587 |
| ↳ interest / principal | S$887 / S$1,700 |
| Corp tax (17%) | S$246 |
| Net cash flow | −S$499/mo shortfall |
| Gross yield | 3.81% |
| Cap rate | 2.95% |
6.65%
equity return
cf + principal / equity in
cf + principal / equity in
A charges S$3,621/mo to own business vs market rent S$3,020/mo
(+S$601/mo vs market).
Yr1 principal paydown: S$20,399/yr (locked equity).
1.4% p.a. (midpoint of 1.2–1.6% market range) · A: own-use · B: investment · both 80% LTV ·
0.70 psf mgmt · 10% property tax on AV · 17% CIT · Non-res BSD · No ABSD.
Market rent based on zone Grade B/C comps. Not financial advice.
📉 Scenario C: Run-to-end (no exit) · tap to expand
📉 Scenario C · Leasehold Run-to-end
No exit sale · 2% rent p.a. · 80% LTV · hold 60 yrs to lease expiry
Loan paydown equity is trapped — cannot be realised without a buyer.
Returns below are purely from net rental cash flows.
Rent & occupancy assumptions
| Yr 1–10 | Company own-use · BE rent · CF ≈ 0 |
| Yr 11–30 | External tenant · 90% occ · market rent |
| Yr 31+ | External tenant · 80% occ · market rent |
| Rent growth | 2% p.a. · decays as lease shortens |
| Property tax | Tracks rent (AV-based) · flat during own-use |
| Terminal / exit value | S$0 |
Cash flow summary
Avg CF over each period. Yr 1–10 ≈ S$0/yr (BE rent covers costs). Turns positive post-loan.
| Equity invested (80% LTV) | S$216,600 |
| Avg annual CF · loan period (30 yrs) | S$876/yr S$73/mo |
| Avg annual CF · post-loan (30 yrs) | S$44,672/yr S$3,723/mo |
| Total cash back over 60 yrs | S$1,366,444 |
| Net profit / (loss) | +S$1,149,844 |
4.2%
IRR over 60 yrs
no exit · 2% rent p.a. · 100%/90%/80% occ by decade
no exit · 2% rent p.a. · 100%/90%/80% occ by decade
Bugis
99LH
Burlington Square
S$1,020,000 S$1,789 psf
570 sqft · DT13 Rochor MRT Station
Agent: Seryn Wee
1 other agent(s) listing this unit
📊 Financial Analysis · tap to collapse
📊 Financial Model
A: own-use · B: investment · both 80% LTV · 1.4% p.a. · 17% corp tax
Remaining lease
74 yrs remaining
Expires ~2100
Acquisition costs
| Purchase price | S$1,020,000 |
| BSD (non-residential) | S$25,400 |
| Legal fees (est.) | S$3,500 |
| ↳ Down payment (20%) + BSD + legal | S$232,900 |
| ↳ Loan (80%) | S$816,000 |
| ↳ Scenario B equity (same) | S$232,900 |
Monthly mortgage & opex
| Mgmt fee (0.70 psf/mo) | S$399 |
| Property tax (10% of AV S$37,620) | S$314 |
Rental scenarios
A · Own-use (80% LTV)
Rent covers mortgage + mgmt + property tax
S$3,864 /mo · 6.78 psf
| Mortgage (30yr @ 1.4%) | S$2,777 |
| ↳ interest / principal | S$952 / S$1,825 |
| Corp tax (17%) | S$374 |
| Net cash flow | +S$0/mo surplus |
| Gross yield | 4.55% |
| Cap rate | 3.71% |
9.41%
equity return
cf + principal / equity in
cf + principal / equity in
vs
B · Investment (80% LTV)
Market rent 5.50 psf · equity S$232,900
S$3,135 /mo · 5.50 psf
| Mortgage (30yr @ 1.4%) | S$2,777 |
| ↳ interest / principal | S$952 / S$1,825 |
| Corp tax (17%) | S$250 |
| Net cash flow | −S$605/mo shortfall |
| Gross yield | 3.69% |
| Cap rate | 2.85% |
6.29%
equity return
cf + principal / equity in
cf + principal / equity in
A charges S$3,864/mo to own business vs market rent S$3,135/mo
(+S$729/mo vs market).
Yr1 principal paydown: S$21,902/yr (locked equity).
1.4% p.a. (midpoint of 1.2–1.6% market range) · A: own-use · B: investment · both 80% LTV ·
0.70 psf mgmt · 10% property tax on AV · 17% CIT · Non-res BSD · No ABSD.
Market rent based on zone Grade B/C comps. Not financial advice.
📉 Scenario C: Run-to-end (no exit) · tap to expand
📉 Scenario C · Leasehold Run-to-end
No exit sale · 2% rent p.a. · 80% LTV · hold 74 yrs to lease expiry
Loan paydown equity is trapped — cannot be realised without a buyer.
Returns below are purely from net rental cash flows.
Rent & occupancy assumptions
| Yr 1–10 | Company own-use · BE rent · CF ≈ 0 |
| Yr 11–30 | External tenant · 90% occ · market rent |
| Yr 31+ | External tenant · 80% occ · market rent |
| Rent growth | 2% p.a. · decays as lease shortens |
| Property tax | Tracks rent (AV-based) · flat during own-use |
| Terminal / exit value | S$0 |
Cash flow summary
Avg CF over each period. Yr 1–10 ≈ S$0/yr (BE rent covers costs). Turns positive post-loan.
| Equity invested (80% LTV) | S$232,900 |
| Avg annual CF · loan period (30 yrs) | S$191/yr S$16/mo |
| Avg annual CF · post-loan (44 yrs) | S$55,701/yr S$4,642/mo |
| Total cash back over 74 yrs | S$2,456,573 |
| Net profit / (loss) | +S$2,223,673 |
4.6%
IRR over 74 yrs
no exit · 2% rent p.a. · 100%/90%/80% occ by decade
no exit · 2% rent p.a. · 100%/90%/80% occ by decade
📊 Financial Analysis · tap to collapse
📊 Financial Model
A: own-use · B: investment · both 80% LTV · 1.4% p.a. · 17% corp tax
Remaining lease
50 yrs remaining
Expires ~2076
Acquisition costs
| Purchase price | S$980,000 |
| BSD (non-residential) | S$24,000 |
| Legal fees (est.) | S$3,500 |
| ↳ Down payment (20%) + BSD + legal | S$223,500 |
| ↳ Loan (80%) | S$784,000 |
| ↳ Scenario B equity (same) | S$223,500 |
Monthly mortgage & opex
| Mgmt fee (0.70 psf/mo) | S$527 |
| Property tax (10% of AV S$49,698) | S$414 |
Rental scenarios
A · Own-use (80% LTV)
Rent covers mortgage + mgmt + property tax
S$3,969 /mo · 5.27 psf
| Mortgage (30yr @ 1.4%) | S$2,668 |
| ↳ interest / principal | S$915 / S$1,754 |
| Corp tax (17%) | S$359 |
| Net cash flow | +S$0/mo surplus |
| Gross yield | 4.86% |
| Cap rate | 3.71% |
9.42%
equity return
cf + principal / equity in
cf + principal / equity in
vs
B · Investment (80% LTV)
Market rent 5.50 psf · equity S$223,500
S$4,142 /mo · 5.50 psf
| Mortgage (30yr @ 1.4%) | S$2,668 |
| ↳ interest / principal | S$915 / S$1,754 |
| Corp tax (17%) | S$389 |
| Net cash flow | +S$144/mo surplus |
| Gross yield | 5.07% |
| Cap rate | 3.92% |
10.19%
equity return
cf + principal / equity in
cf + principal / equity in
A charges S$3,969/mo to own business vs market rent S$4,142/mo
(−S$173/mo vs market).
Yr1 principal paydown: S$21,043/yr (locked equity).
1.4% p.a. (midpoint of 1.2–1.6% market range) · A: own-use · B: investment · both 80% LTV ·
0.70 psf mgmt · 10% property tax on AV · 17% CIT · Non-res BSD · No ABSD.
Market rent based on zone Grade B/C comps. Not financial advice.
📉 Scenario C: Run-to-end (no exit) · tap to expand
📉 Scenario C · Leasehold Run-to-end
No exit sale · 2% rent p.a. · 80% LTV · hold 50 yrs to lease expiry
Loan paydown equity is trapped — cannot be realised without a buyer.
Returns below are purely from net rental cash flows.
Rent & occupancy assumptions
| Yr 1–10 | Company own-use · BE rent · CF ≈ 0 |
| Yr 11–30 | External tenant · 90% occ · market rent |
| Yr 31+ | External tenant · 80% occ · market rent |
| Rent growth | 2% p.a. · decays as lease shortens |
| Property tax | Tracks rent (AV-based) · flat during own-use |
| Terminal / exit value | S$0 |
Cash flow summary
Avg CF over each period. Yr 1–10 ≈ S$0/yr (BE rent covers costs). Turns positive post-loan.
| Equity invested (80% LTV) | S$223,500 |
| Avg annual CF · loan period (30 yrs) | S$7,950/yr S$663/mo |
| Avg annual CF · post-loan (20 yrs) | S$53,330/yr S$4,444/mo |
| Total cash back over 50 yrs | S$1,305,110 |
| Net profit / (loss) | +S$1,081,610 |
5.1%
IRR over 50 yrs
no exit · 2% rent p.a. · 100%/90%/80% occ by decade
no exit · 2% rent p.a. · 100%/90%/80% occ by decade
Bugis
99LH
Sunshine Plaza
S$1,100,000 S$1,964 psf
560 sqft · DT21 Bencoolen MRT Station
Agent: Evelyn Tan
📊 Financial Analysis · tap to collapse
📊 Financial Model
A: own-use · B: investment · both 80% LTV · 1.4% p.a. · 17% corp tax
Remaining lease
75 yrs remaining
Expires ~2101
Acquisition costs
| Purchase price | S$1,100,000 |
| BSD (non-residential) | S$28,600 |
| Legal fees (est.) | S$3,500 |
| ↳ Down payment (20%) + BSD + legal | S$252,100 |
| ↳ Loan (80%) | S$880,000 |
| ↳ Scenario B equity (same) | S$252,100 |
Monthly mortgage & opex
| Mgmt fee (0.70 psf/mo) | S$392 |
| Property tax (10% of AV S$36,960) | S$308 |
Rental scenarios
A · Own-use (80% LTV)
Rent covers mortgage + mgmt + property tax
S$4,098 /mo · 7.32 psf
| Mortgage (30yr @ 1.4%) | S$2,995 |
| ↳ interest / principal | S$1,027 / S$1,968 |
| Corp tax (17%) | S$403 |
| Net cash flow | −S$0/mo shortfall |
| Gross yield | 4.47% |
| Cap rate | 3.71% |
9.37%
equity return
cf + principal / equity in
cf + principal / equity in
vs
B · Investment (80% LTV)
Market rent 5.50 psf · equity S$252,100
S$3,080 /mo · 5.50 psf
| Mortgage (30yr @ 1.4%) | S$2,995 |
| ↳ interest / principal | S$1,027 / S$1,968 |
| Corp tax (17%) | S$230 |
| Net cash flow | −S$845/mo shortfall |
| Gross yield | 3.36% |
| Cap rate | 2.60% |
5.35%
equity return
cf + principal / equity in
cf + principal / equity in
A charges S$4,098/mo to own business vs market rent S$3,080/mo
(+S$1,018/mo vs market).
Yr1 principal paydown: S$23,620/yr (locked equity).
1.4% p.a. (midpoint of 1.2–1.6% market range) · A: own-use · B: investment · both 80% LTV ·
0.70 psf mgmt · 10% property tax on AV · 17% CIT · Non-res BSD · No ABSD.
Market rent based on zone Grade B/C comps. Not financial advice.
📉 Scenario C: Run-to-end (no exit) · tap to expand
📉 Scenario C · Leasehold Run-to-end
No exit sale · 2% rent p.a. · 80% LTV · hold 75 yrs to lease expiry
Loan paydown equity is trapped — cannot be realised without a buyer.
Returns below are purely from net rental cash flows.
Rent & occupancy assumptions
| Yr 1–10 | Company own-use · BE rent · CF ≈ 0 |
| Yr 11–30 | External tenant · 90% occ · market rent |
| Yr 31+ | External tenant · 80% occ · market rent |
| Rent growth | 2% p.a. · decays as lease shortens |
| Property tax | Tracks rent (AV-based) · flat during own-use |
| Terminal / exit value | S$0 |
Cash flow summary
Avg CF over each period. Yr 1–10 ≈ S$0/yr (BE rent covers costs). Turns positive post-loan.
| Equity invested (80% LTV) | S$252,100 |
| Avg annual CF · loan period (30 yrs) | S$-1,909/yr S$-159/mo |
| Avg annual CF · post-loan (45 yrs) | S$55,432/yr S$4,619/mo |
| Total cash back over 75 yrs | S$2,437,162 |
| Net profit / (loss) | +S$2,185,062 |
4.2%
IRR over 75 yrs
no exit · 2% rent p.a. · 100%/90%/80% occ by decade
no exit · 2% rent p.a. · 100%/90%/80% occ by decade
Paya Lebar
FH
Centropod
S$950,000 S$1,468 psf
647 sqft · EW7 Eunos MRT Station
Agent: Kimberly Lim 林梨梅
📊 Financial Analysis · tap to collapse
📊 Financial Model
A: own-use · B: investment · both 80% LTV · 1.4% p.a. · 17% corp tax
Remaining lease
Freehold / 999-yr
No expiry
Acquisition costs
| Purchase price | S$950,000 |
| BSD (non-residential) | S$23,100 |
| Legal fees (est.) | S$3,500 |
| ↳ Down payment (20%) + BSD + legal | S$216,600 |
| ↳ Loan (80%) | S$760,000 |
| ↳ Scenario B equity (same) | S$216,600 |
Monthly mortgage & opex
| Mgmt fee (0.65 psf/mo) | S$421 |
| Property tax (10% of AV S$34,938) | S$291 |
Rental scenarios
A · Own-use (80% LTV)
Rent covers mortgage + mgmt + property tax
S$3,646 /mo · 5.64 psf
| Mortgage (30yr @ 1.4%) | S$2,587 |
| ↳ interest / principal | S$887 / S$1,700 |
| Corp tax (17%) | S$348 |
| Net cash flow | −S$0/mo shortfall |
| Gross yield | 4.61% |
| Cap rate | 3.71% |
9.42%
equity return
cf + principal / equity in
cf + principal / equity in
vs
B · Investment (80% LTV)
Market rent 4.50 psf · equity S$216,600
S$2,912 /mo · 4.50 psf
| Mortgage (30yr @ 1.4%) | S$2,587 |
| ↳ interest / principal | S$887 / S$1,700 |
| Corp tax (17%) | S$223 |
| Net cash flow | −S$610/mo shortfall |
| Gross yield | 3.68% |
| Cap rate | 2.78% |
6.04%
equity return
cf + principal / equity in
cf + principal / equity in
A charges S$3,646/mo to own business vs market rent S$2,912/mo
(+S$734/mo vs market).
Yr1 principal paydown: S$20,399/yr (locked equity).
1.4% p.a. (midpoint of 1.2–1.6% market range) · A: own-use · B: investment · both 80% LTV ·
0.65 psf mgmt · 10% property tax on AV · 17% CIT · Non-res BSD · No ABSD.
Market rent based on zone Grade B/C comps. Not financial advice.
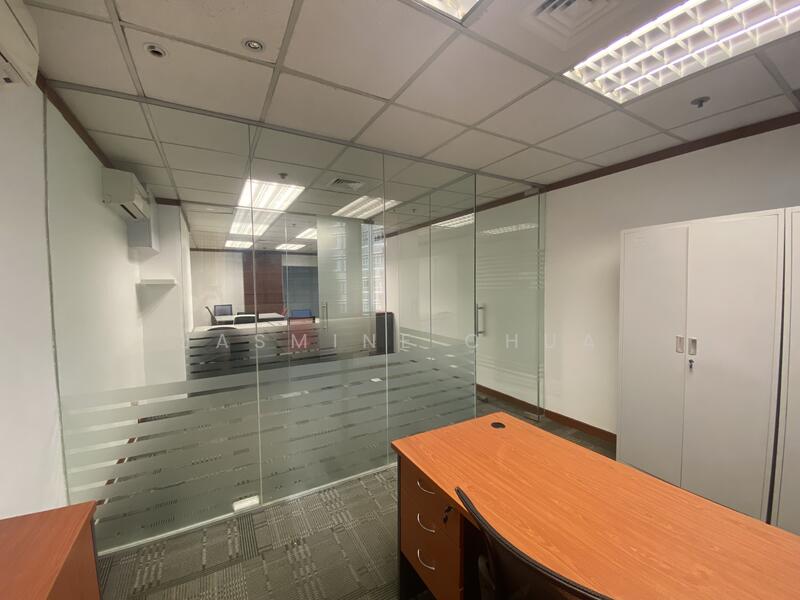
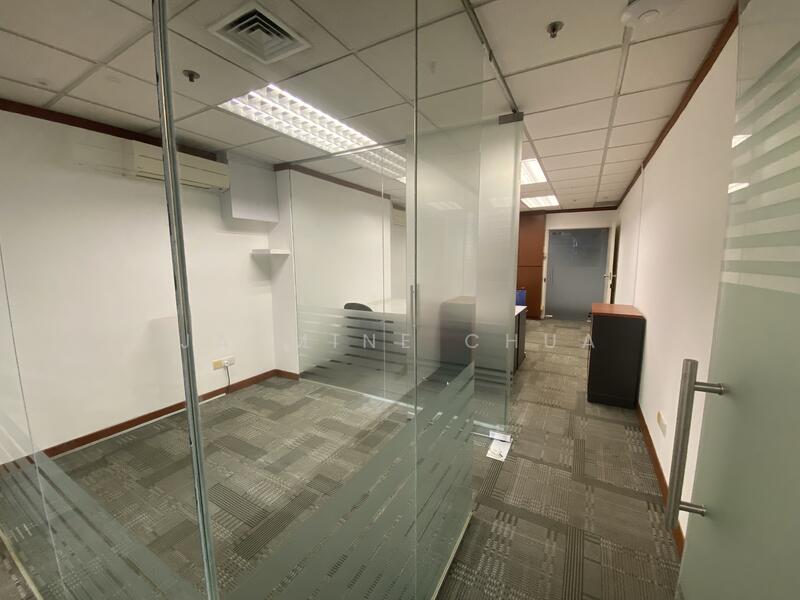
Tanjong Pagar
99LH
International Plaza
S$980,000 S$2,068 psf
474 sqft · EW15 Tanjong Pagar MRT Station
Agent: Jasmine Chua
2 other agent(s) listing this unit
📊 Financial Analysis · tap to collapse
📊 Financial Model
A: own-use · B: investment · both 80% LTV · 1.4% p.a. · 17% corp tax
Remaining lease
47 yrs remaining
Expires ~2073
Acquisition costs
| Purchase price | S$980,000 |
| BSD (non-residential) | S$24,000 |
| Legal fees (est.) | S$3,500 |
| ↳ Down payment (20%) + BSD + legal | S$223,500 |
| ↳ Loan (80%) | S$784,000 |
| ↳ Scenario B equity (same) | S$223,500 |
Monthly mortgage & opex
| Mgmt fee (0.75 psf/mo) | S$356 |
| Property tax (10% of AV S$34,128) | S$284 |
Rental scenarios
A · Own-use (80% LTV)
Rent covers mortgage + mgmt + property tax
S$3,667 /mo · 7.74 psf
| Mortgage (30yr @ 1.4%) | S$2,668 |
| ↳ interest / principal | S$915 / S$1,754 |
| Corp tax (17%) | S$359 |
| Net cash flow | −S$0/mo shortfall |
| Gross yield | 4.49% |
| Cap rate | 3.71% |
9.41%
equity return
cf + principal / equity in
cf + principal / equity in
vs
B · Investment (80% LTV)
Market rent 6.00 psf · equity S$223,500
S$2,844 /mo · 6.00 psf
| Mortgage (30yr @ 1.4%) | S$2,668 |
| ↳ interest / principal | S$915 / S$1,754 |
| Corp tax (17%) | S$219 |
| Net cash flow | −S$683/mo shortfall |
| Gross yield | 3.48% |
| Cap rate | 2.70% |
5.75%
equity return
cf + principal / equity in
cf + principal / equity in
A charges S$3,667/mo to own business vs market rent S$2,844/mo
(+S$823/mo vs market).
Yr1 principal paydown: S$21,043/yr (locked equity).
1.4% p.a. (midpoint of 1.2–1.6% market range) · A: own-use · B: investment · both 80% LTV ·
0.75 psf mgmt · 10% property tax on AV · 17% CIT · Non-res BSD · No ABSD.
Market rent based on zone Grade B/C comps. Not financial advice.
📉 Scenario C: Run-to-end (no exit) · tap to expand
📉 Scenario C · Leasehold Run-to-end
No exit sale · 2% rent p.a. · 80% LTV · hold 47 yrs to lease expiry
Loan paydown equity is trapped — cannot be realised without a buyer.
Returns below are purely from net rental cash flows.
Rent & occupancy assumptions
| Yr 1–10 | Company own-use · BE rent · CF ≈ 0 |
| Yr 11–30 | External tenant · 90% occ · market rent |
| Yr 31+ | External tenant · 80% occ · market rent |
| Rent growth | 2% p.a. · decays as lease shortens |
| Property tax | Tracks rent (AV-based) · flat during own-use |
| Terminal / exit value | S$0 |
Cash flow summary
Avg CF over each period. Yr 1–10 ≈ S$0/yr (BE rent covers costs). Turns positive post-loan.
| Equity invested (80% LTV) | S$223,500 |
| Avg annual CF · loan period (30 yrs) | S$-1,158/yr S$-96/mo |
| Avg annual CF · post-loan (17 yrs) | S$35,111/yr S$2,926/mo |
| Total cash back over 47 yrs | S$562,152 |
| Net profit / (loss) | +S$338,652 |
2.2%
IRR over 47 yrs
no exit · 2% rent p.a. · 100%/90%/80% occ by decade
no exit · 2% rent p.a. · 100%/90%/80% occ by decade
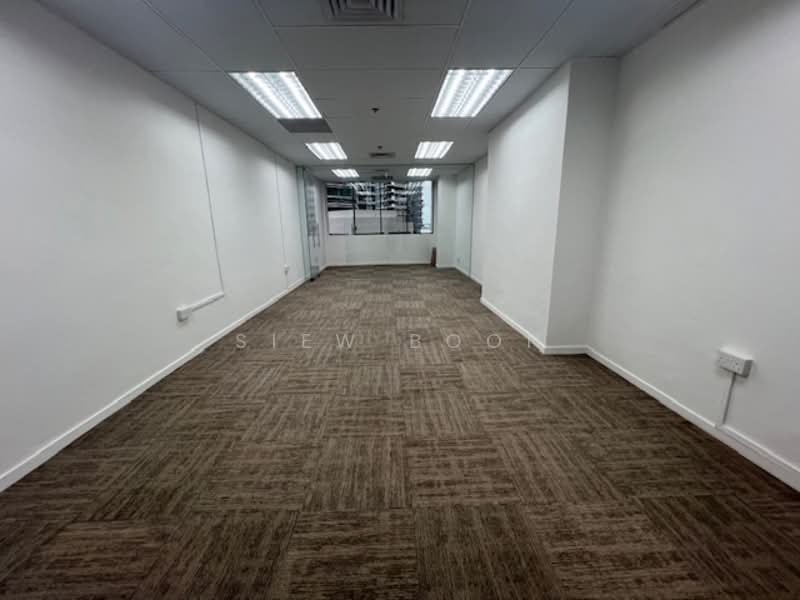
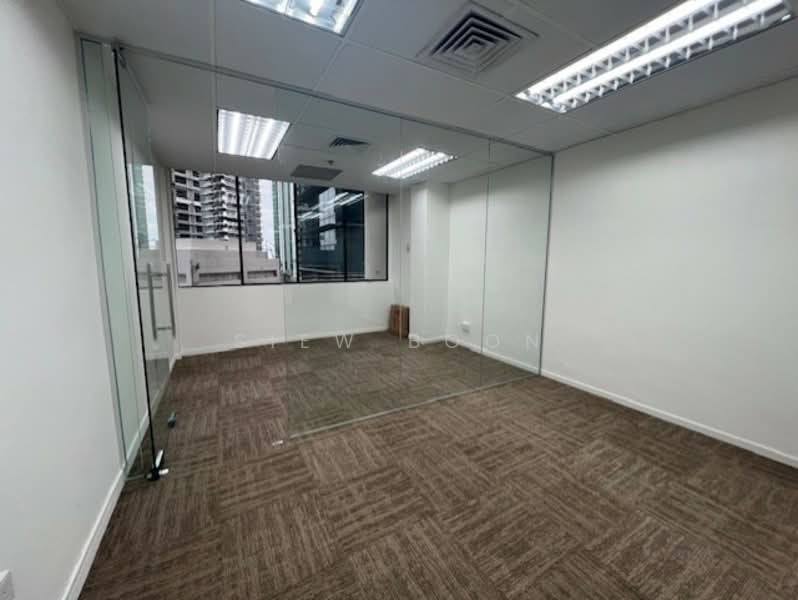
Tanjong Pagar
99LH
International Plaza
S$950,000 S$2,052 psf
463 sqft · EW15 Tanjong Pagar MRT Station
Agent: Siew Boon
1 other agent(s) listing this unit
📊 Financial Analysis · tap to collapse
📊 Financial Model
A: own-use · B: investment · both 80% LTV · 1.4% p.a. · 17% corp tax
Remaining lease
47 yrs remaining
Expires ~2073
Acquisition costs
| Purchase price | S$950,000 |
| BSD (non-residential) | S$23,100 |
| Legal fees (est.) | S$3,500 |
| ↳ Down payment (20%) + BSD + legal | S$216,600 |
| ↳ Loan (80%) | S$760,000 |
| ↳ Scenario B equity (same) | S$216,600 |
Monthly mortgage & opex
| Mgmt fee (0.75 psf/mo) | S$347 |
| Property tax (10% of AV S$33,336) | S$278 |
Rental scenarios
A · Own-use (80% LTV)
Rent covers mortgage + mgmt + property tax
S$3,560 /mo · 7.69 psf
| Mortgage (30yr @ 1.4%) | S$2,587 |
| ↳ interest / principal | S$887 / S$1,700 |
| Corp tax (17%) | S$348 |
| Net cash flow | +S$0/mo surplus |
| Gross yield | 4.50% |
| Cap rate | 3.71% |
9.42%
equity return
cf + principal / equity in
cf + principal / equity in
vs
B · Investment (80% LTV)
Market rent 6.00 psf · equity S$216,600
S$2,778 /mo · 6.00 psf
| Mortgage (30yr @ 1.4%) | S$2,587 |
| ↳ interest / principal | S$887 / S$1,700 |
| Corp tax (17%) | S$215 |
| Net cash flow | −S$649/mo shortfall |
| Gross yield | 3.51% |
| Cap rate | 2.72% |
5.82%
equity return
cf + principal / equity in
cf + principal / equity in
A charges S$3,560/mo to own business vs market rent S$2,778/mo
(+S$782/mo vs market).
Yr1 principal paydown: S$20,399/yr (locked equity).
1.4% p.a. (midpoint of 1.2–1.6% market range) · A: own-use · B: investment · both 80% LTV ·
0.75 psf mgmt · 10% property tax on AV · 17% CIT · Non-res BSD · No ABSD.
Market rent based on zone Grade B/C comps. Not financial advice.
📉 Scenario C: Run-to-end (no exit) · tap to expand
📉 Scenario C · Leasehold Run-to-end
No exit sale · 2% rent p.a. · 80% LTV · hold 47 yrs to lease expiry
Loan paydown equity is trapped — cannot be realised without a buyer.
Returns below are purely from net rental cash flows.
Rent & occupancy assumptions
| Yr 1–10 | Company own-use · BE rent · CF ≈ 0 |
| Yr 11–30 | External tenant · 90% occ · market rent |
| Yr 31+ | External tenant · 80% occ · market rent |
| Rent growth | 2% p.a. · decays as lease shortens |
| Property tax | Tracks rent (AV-based) · flat during own-use |
| Terminal / exit value | S$0 |
Cash flow summary
Avg CF over each period. Yr 1–10 ≈ S$0/yr (BE rent covers costs). Turns positive post-loan.
| Equity invested (80% LTV) | S$216,600 |
| Avg annual CF · loan period (30 yrs) | S$-974/yr S$-81/mo |
| Avg annual CF · post-loan (17 yrs) | S$34,296/yr S$2,858/mo |
| Total cash back over 47 yrs | S$553,816 |
| Net profit / (loss) | +S$337,216 |
2.3%
IRR over 47 yrs
no exit · 2% rent p.a. · 100%/90%/80% occ by decade
no exit · 2% rent p.a. · 100%/90%/80% occ by decade
Tanjong Pagar
99LH
International Plaza
S$938,000 S$1,979 psf
474 sqft · EW15 Tanjong Pagar MRT Station
Agent: Kenny Koh
📊 Financial Analysis · tap to collapse
📊 Financial Model
A: own-use · B: investment · both 80% LTV · 1.4% p.a. · 17% corp tax
Remaining lease
47 yrs remaining
Expires ~2073
Acquisition costs
| Purchase price | S$938,000 |
| BSD (non-residential) | S$22,740 |
| Legal fees (est.) | S$3,500 |
| ↳ Down payment (20%) + BSD + legal | S$213,840 |
| ↳ Loan (80%) | S$750,400 |
| ↳ Scenario B equity (same) | S$213,840 |
Monthly mortgage & opex
| Mgmt fee (0.75 psf/mo) | S$356 |
| Property tax (10% of AV S$34,128) | S$284 |
Rental scenarios
A · Own-use (80% LTV)
Rent covers mortgage + mgmt + property tax
S$3,538 /mo · 7.46 psf
| Mortgage (30yr @ 1.4%) | S$2,554 |
| ↳ interest / principal | S$875 / S$1,678 |
| Corp tax (17%) | S$344 |
| Net cash flow | +S$0/mo surplus |
| Gross yield | 4.53% |
| Cap rate | 3.71% |
9.42%
equity return
cf + principal / equity in
cf + principal / equity in
vs
B · Investment (80% LTV)
Market rent 6.00 psf · equity S$213,840
S$2,844 /mo · 6.00 psf
| Mortgage (30yr @ 1.4%) | S$2,554 |
| ↳ interest / principal | S$875 / S$1,678 |
| Corp tax (17%) | S$226 |
| Net cash flow | −S$576/mo shortfall |
| Gross yield | 3.64% |
| Cap rate | 2.82% |
6.19%
equity return
cf + principal / equity in
cf + principal / equity in
A charges S$3,538/mo to own business vs market rent S$2,844/mo
(+S$694/mo vs market).
Yr1 principal paydown: S$20,142/yr (locked equity).
1.4% p.a. (midpoint of 1.2–1.6% market range) · A: own-use · B: investment · both 80% LTV ·
0.75 psf mgmt · 10% property tax on AV · 17% CIT · Non-res BSD · No ABSD.
Market rent based on zone Grade B/C comps. Not financial advice.
📉 Scenario C: Run-to-end (no exit) · tap to expand
📉 Scenario C · Leasehold Run-to-end
No exit sale · 2% rent p.a. · 80% LTV · hold 47 yrs to lease expiry
Loan paydown equity is trapped — cannot be realised without a buyer.
Returns below are purely from net rental cash flows.
Rent & occupancy assumptions
| Yr 1–10 | Company own-use · BE rent · CF ≈ 0 |
| Yr 11–30 | External tenant · 90% occ · market rent |
| Yr 31+ | External tenant · 80% occ · market rent |
| Rent growth | 2% p.a. · decays as lease shortens |
| Property tax | Tracks rent (AV-based) · flat during own-use |
| Terminal / exit value | S$0 |
Cash flow summary
Avg CF over each period. Yr 1–10 ≈ S$0/yr (BE rent covers costs). Turns positive post-loan.
| Equity invested (80% LTV) | S$213,840 |
| Avg annual CF · loan period (30 yrs) | S$-257/yr S$-21/mo |
| Avg annual CF · post-loan (17 yrs) | S$35,111/yr S$2,926/mo |
| Total cash back over 47 yrs | S$589,185 |
| Net profit / (loss) | +S$375,345 |
2.5%
IRR over 47 yrs
no exit · 2% rent p.a. · 100%/90%/80% occ by decade
no exit · 2% rent p.a. · 100%/90%/80% occ by decade
Tanjong Pagar
FH
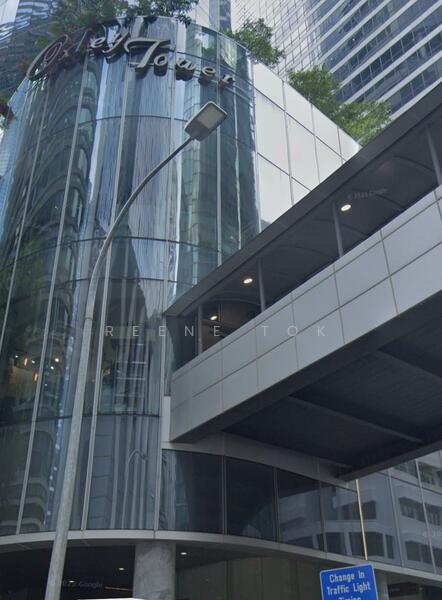
Oxley Tower
S$690,000 S$3,557 psf
194 sqft · TE19 Shenton Way MRT Station
Agent: Reene Tok
📊 Financial Analysis · tap to collapse
📊 Financial Model
A: own-use · B: investment · both 80% LTV · 1.4% p.a. · 17% corp tax
Remaining lease
Freehold / 999-yr
No expiry
Acquisition costs
| Purchase price | S$690,000 |
| BSD (non-residential) | S$15,300 |
| Legal fees (est.) | S$3,500 |
| ↳ Down payment (20%) + BSD + legal | S$156,800 |
| ↳ Loan (80%) | S$552,000 |
| ↳ Scenario B equity (same) | S$156,800 |
Monthly mortgage & opex
| Mgmt fee (0.75 psf/mo) | S$146 |
| Property tax (10% of AV S$13,968) | S$116 |
Rental scenarios
A · Own-use (80% LTV)
Rent covers mortgage + mgmt + property tax
S$2,393 /mo · 12.34 psf
| Mortgage (30yr @ 1.4%) | S$1,879 |
| ↳ interest / principal | S$644 / S$1,235 |
| Corp tax (17%) | S$253 |
| Net cash flow | −S$0/mo shortfall |
| Gross yield | 4.16% |
| Cap rate | 3.71% |
9.45%
equity return
cf + principal / equity in
cf + principal / equity in
vs
B · Investment (80% LTV)
Market rent 6.00 psf · equity S$156,800
S$1,164 /mo · 6.00 psf
| Mortgage (30yr @ 1.4%) | S$1,879 |
| ↳ interest / principal | S$644 / S$1,235 |
| Corp tax (17%) | S$44 |
| Net cash flow | −S$1,020/mo shortfall |
| Gross yield | 2.02% |
| Cap rate | 1.57% |
1.64%
equity return
cf + principal / equity in
cf + principal / equity in
A charges S$2,393/mo to own business vs market rent S$1,164/mo
(+S$1,229/mo vs market).
Yr1 principal paydown: S$14,816/yr (locked equity).
1.4% p.a. (midpoint of 1.2–1.6% market range) · A: own-use · B: investment · both 80% LTV ·
0.75 psf mgmt · 10% property tax on AV · 17% CIT · Non-res BSD · No ABSD.
Market rent based on zone Grade B/C comps. Not financial advice.
Tanjong Pagar
FH
B1 Industrial Freehold Office Space at Next to Tai Seng MRT
S$988,000 S$2,298 psf
430 sqft · CC11 Tai Seng MRT Station
Agent: Ben Tan
📊 Financial Analysis · tap to collapse
📊 Financial Model
A: own-use · B: investment · both 80% LTV · 1.4% p.a. · 17% corp tax
Remaining lease
Freehold / 999-yr
No expiry
Acquisition costs
| Purchase price | S$988,000 |
| BSD (non-residential) | S$24,240 |
| Legal fees (est.) | S$3,500 |
| ↳ Down payment (20%) + BSD + legal | S$225,340 |
| ↳ Loan (80%) | S$790,400 |
| ↳ Scenario B equity (same) | S$225,340 |
Monthly mortgage & opex
| Mgmt fee (0.75 psf/mo) | S$322 |
| Property tax (10% of AV S$30,960) | S$258 |
Rental scenarios
A · Own-use (80% LTV)
Rent covers mortgage + mgmt + property tax
S$3,633 /mo · 8.45 psf
| Mortgage (30yr @ 1.4%) | S$2,690 |
| ↳ interest / principal | S$922 / S$1,768 |
| Corp tax (17%) | S$362 |
| Net cash flow | +S$0/mo surplus |
| Gross yield | 4.41% |
| Cap rate | 3.71% |
9.42%
equity return
cf + principal / equity in
cf + principal / equity in
vs
B · Investment (80% LTV)
Market rent 6.00 psf · equity S$225,340
S$2,580 /mo · 6.00 psf
| Mortgage (30yr @ 1.4%) | S$2,690 |
| ↳ interest / principal | S$922 / S$1,768 |
| Corp tax (17%) | S$183 |
| Net cash flow | −S$874/mo shortfall |
| Gross yield | 3.13% |
| Cap rate | 2.43% |
4.76%
equity return
cf + principal / equity in
cf + principal / equity in
A charges S$3,633/mo to own business vs market rent S$2,580/mo
(+S$1,053/mo vs market).
Yr1 principal paydown: S$21,215/yr (locked equity).
1.4% p.a. (midpoint of 1.2–1.6% market range) · A: own-use · B: investment · both 80% LTV ·
0.75 psf mgmt · 10% property tax on AV · 17% CIT · Non-res BSD · No ABSD.
Market rent based on zone Grade B/C comps. Not financial advice.
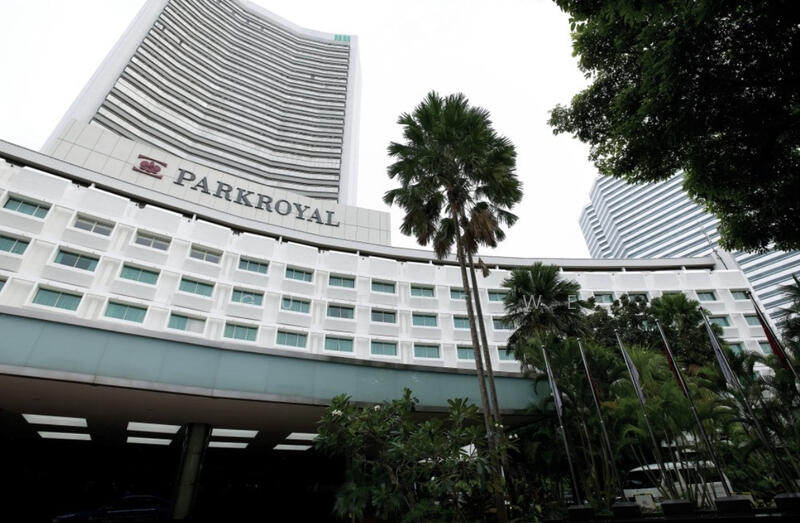
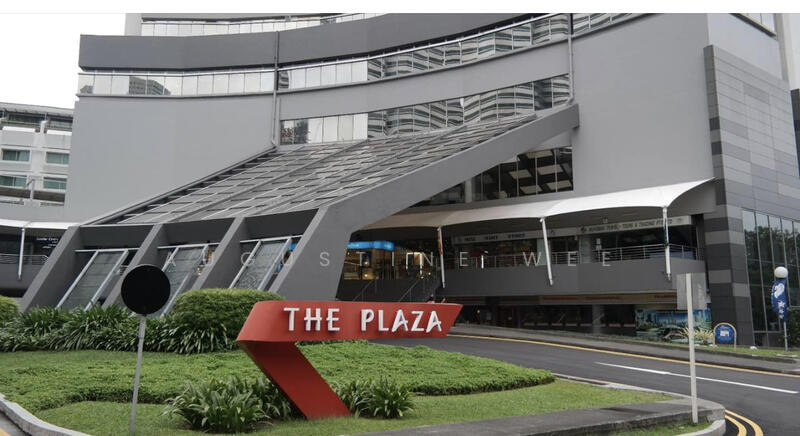
📊 Financial Analysis · tap to collapse
📊 Financial Model
A: own-use · B: investment · both 80% LTV · 1.4% p.a. · 17% corp tax
Remaining lease
41 yrs remaining
Expires ~2067
Acquisition costs
| Purchase price | S$980,000 |
| BSD (non-residential) | S$24,000 |
| Legal fees (est.) | S$3,500 |
| ↳ Down payment (20%) + BSD + legal | S$223,500 |
| ↳ Loan (80%) | S$784,000 |
| ↳ Scenario B equity (same) | S$223,500 |
Monthly mortgage & opex
| Mgmt fee (0.80 psf/mo) | S$430 |
| Property tax (10% of AV S$38,736) | S$323 |
Rental scenarios
A · Own-use (80% LTV)
Rent covers mortgage + mgmt + property tax
S$3,781 /mo · 7.03 psf
| Mortgage (30yr @ 1.4%) | S$2,668 |
| ↳ interest / principal | S$915 / S$1,754 |
| Corp tax (17%) | S$359 |
| Net cash flow | +S$0/mo surplus |
| Gross yield | 4.63% |
| Cap rate | 3.71% |
9.42%
equity return
cf + principal / equity in
cf + principal / equity in
vs
B · Investment (80% LTV)
Market rent 6.00 psf · equity S$223,500
S$3,228 /mo · 6.00 psf
| Mortgage (30yr @ 1.4%) | S$2,668 |
| ↳ interest / principal | S$915 / S$1,754 |
| Corp tax (17%) | S$265 |
| Net cash flow | −S$459/mo shortfall |
| Gross yield | 3.95% |
| Cap rate | 3.03% |
6.95%
equity return
cf + principal / equity in
cf + principal / equity in
A charges S$3,781/mo to own business vs market rent S$3,228/mo
(+S$553/mo vs market).
Yr1 principal paydown: S$21,043/yr (locked equity).
1.4% p.a. (midpoint of 1.2–1.6% market range) · A: own-use · B: investment · both 80% LTV ·
0.80 psf mgmt · 10% property tax on AV · 17% CIT · Non-res BSD · No ABSD.
Market rent based on zone Grade B/C comps. Not financial advice.
📉 Scenario C: Run-to-end (no exit) · tap to expand
📉 Scenario C · Leasehold Run-to-end
No exit sale · 2% rent p.a. · 80% LTV · hold 41 yrs to lease expiry
Loan paydown equity is trapped — cannot be realised without a buyer.
Returns below are purely from net rental cash flows.
Rent & occupancy assumptions
| Yr 1–10 | Company own-use · BE rent · CF ≈ 0 |
| Yr 11–30 | External tenant · 90% occ · market rent |
| Yr 31+ | External tenant · 80% occ · market rent |
| Rent growth | 2% p.a. · decays as lease shortens |
| Property tax | Tracks rent (AV-based) · flat during own-use |
| Terminal / exit value | S$0 |
Cash flow summary
Avg CF over each period. Yr 1–10 ≈ S$0/yr (BE rent covers costs). Turns positive post-loan.
| Equity invested (80% LTV) | S$223,500 |
| Avg annual CF · loan period (30 yrs) | S$968/yr S$81/mo |
| Avg annual CF · post-loan (11 yrs) | S$36,110/yr S$3,009/mo |
| Total cash back over 41 yrs | S$426,244 |
| Net profit / (loss) | +S$202,744 |
1.8%
IRR over 41 yrs
no exit · 2% rent p.a. · 100%/90%/80% occ by decade
no exit · 2% rent p.a. · 100%/90%/80% occ by decade


Shenton Way
99LH
International Plaza
S$1,050,000 S$2,215 psf
474 sqft · EW15 Tanjong Pagar MRT Station
Agent: Jeffrey Chow
📊 Financial Analysis · tap to collapse
📊 Financial Model
A: own-use · B: investment · both 80% LTV · 1.4% p.a. · 17% corp tax
Remaining lease
47 yrs remaining
Expires ~2073
Acquisition costs
| Purchase price | S$1,050,000 |
| BSD (non-residential) | S$26,600 |
| Legal fees (est.) | S$3,500 |
| ↳ Down payment (20%) + BSD + legal | S$240,100 |
| ↳ Loan (80%) | S$840,000 |
| ↳ Scenario B equity (same) | S$240,100 |
Monthly mortgage & opex
| Mgmt fee (0.80 psf/mo) | S$379 |
| Property tax (10% of AV S$34,128) | S$284 |
Rental scenarios
A · Own-use (80% LTV)
Rent covers mortgage + mgmt + property tax
S$3,907 /mo · 8.24 psf
| Mortgage (30yr @ 1.4%) | S$2,859 |
| ↳ interest / principal | S$980 / S$1,879 |
| Corp tax (17%) | S$385 |
| Net cash flow | −S$0/mo shortfall |
| Gross yield | 4.47% |
| Cap rate | 3.71% |
9.39%
equity return
cf + principal / equity in
cf + principal / equity in
vs
B · Investment (80% LTV)
Market rent 6.00 psf · equity S$240,100
S$2,844 /mo · 6.00 psf
| Mortgage (30yr @ 1.4%) | S$2,859 |
| ↳ interest / principal | S$980 / S$1,879 |
| Corp tax (17%) | S$204 |
| Net cash flow | −S$883/mo shortfall |
| Gross yield | 3.25% |
| Cap rate | 2.49% |
4.98%
equity return
cf + principal / equity in
cf + principal / equity in
A charges S$3,907/mo to own business vs market rent S$2,844/mo
(+S$1,063/mo vs market).
Yr1 principal paydown: S$22,546/yr (locked equity).
1.4% p.a. (midpoint of 1.2–1.6% market range) · A: own-use · B: investment · both 80% LTV ·
0.80 psf mgmt · 10% property tax on AV · 17% CIT · Non-res BSD · No ABSD.
Market rent based on zone Grade B/C comps. Not financial advice.
📉 Scenario C: Run-to-end (no exit) · tap to expand
📉 Scenario C · Leasehold Run-to-end
No exit sale · 2% rent p.a. · 80% LTV · hold 47 yrs to lease expiry
Loan paydown equity is trapped — cannot be realised without a buyer.
Returns below are purely from net rental cash flows.
Rent & occupancy assumptions
| Yr 1–10 | Company own-use · BE rent · CF ≈ 0 |
| Yr 11–30 | External tenant · 90% occ · market rent |
| Yr 31+ | External tenant · 80% occ · market rent |
| Rent growth | 2% p.a. · decays as lease shortens |
| Property tax | Tracks rent (AV-based) · flat during own-use |
| Terminal / exit value | S$0 |
Cash flow summary
Avg CF over each period. Yr 1–10 ≈ S$0/yr (BE rent covers costs). Turns positive post-loan.
| Equity invested (80% LTV) | S$240,100 |
| Avg annual CF · loan period (30 yrs) | S$-2,813/yr S$-234/mo |
| Avg annual CF · post-loan (17 yrs) | S$34,875/yr S$2,906/mo |
| Total cash back over 47 yrs | S$508,493 |
| Net profit / (loss) | +S$268,393 |
1.7%
IRR over 47 yrs
no exit · 2% rent p.a. · 100%/90%/80% occ by decade
no exit · 2% rent p.a. · 100%/90%/80% occ by decade
Bencoolen
99LH
Sunshine Plaza
S$810,000 S$5,329 psf
152 sqft · DT21 Bencoolen MRT Station
Agent: Agnes Yu SF
📊 Financial Analysis · tap to collapse
📊 Financial Model
A: own-use · B: investment · both 80% LTV · 1.4% p.a. · 17% corp tax
Remaining lease
75 yrs remaining
Expires ~2101
Acquisition costs
| Purchase price | S$810,000 |
| BSD (non-residential) | S$18,900 |
| Legal fees (est.) | S$3,500 |
| ↳ Down payment (20%) + BSD + legal | S$184,400 |
| ↳ Loan (80%) | S$648,000 |
| ↳ Scenario B equity (same) | S$184,400 |
Monthly mortgage & opex
| Mgmt fee (0.70 psf/mo) | S$106 |
| Property tax (10% of AV S$9,120) | S$76 |
Rental scenarios
A · Own-use (80% LTV)
Rent covers mortgage + mgmt + property tax
S$2,685 /mo · 17.66 psf
| Mortgage (30yr @ 1.4%) | S$2,205 |
| ↳ interest / principal | S$756 / S$1,449 |
| Corp tax (17%) | S$297 |
| Net cash flow | +S$0/mo surplus |
| Gross yield | 3.98% |
| Cap rate | 3.71% |
9.43%
equity return
cf + principal / equity in
cf + principal / equity in
vs
B · Investment (80% LTV)
Market rent 5.00 psf · equity S$184,400
S$760 /mo · 5.00 psf
| Mortgage (30yr @ 1.4%) | S$2,205 |
| ↳ interest / principal | S$756 / S$1,449 |
| Corp tax (17%) | S$0 |
| Net cash flow | −S$1,628/mo shortfall |
| Gross yield | 1.13% |
| Cap rate | 0.86% |
-1.16%
equity return
cf + principal / equity in
cf + principal / equity in
A charges S$2,685/mo to own business vs market rent S$760/mo
(+S$1,925/mo vs market).
Yr1 principal paydown: S$17,393/yr (locked equity).
1.4% p.a. (midpoint of 1.2–1.6% market range) · A: own-use · B: investment · both 80% LTV ·
0.70 psf mgmt · 10% property tax on AV · 17% CIT · Non-res BSD · No ABSD.
Market rent based on zone Grade B/C comps. Not financial advice.
📉 Scenario C: Run-to-end (no exit) · tap to expand
📉 Scenario C · Leasehold Run-to-end
No exit sale · 2% rent p.a. · 80% LTV · hold 75 yrs to lease expiry
Loan paydown equity is trapped — cannot be realised without a buyer.
Returns below are purely from net rental cash flows.
Rent & occupancy assumptions
| Yr 1–10 | Company own-use · BE rent · CF ≈ 0 |
| Yr 11–30 | External tenant · 90% occ · market rent |
| Yr 31+ | External tenant · 80% occ · market rent |
| Rent growth | 2% p.a. · decays as lease shortens |
| Property tax | Tracks rent (AV-based) · flat during own-use |
| Terminal / exit value | S$0 |
Cash flow summary
Avg CF over each period. Yr 1–10 ≈ S$0/yr (BE rent covers costs). Turns positive post-loan.
| Equity invested (80% LTV) | S$184,400 |
| Avg annual CF · loan period (30 yrs) | S$-12,057/yr S$-1,005/mo |
| Avg annual CF · post-loan (45 yrs) | S$13,582/yr S$1,132/mo |
| Total cash back over 75 yrs | S$249,461 |
| Net profit / (loss) | +S$65,061 |
0.3%
IRR over 75 yrs
no exit · 2% rent p.a. · 100%/90%/80% occ by decade
no exit · 2% rent p.a. · 100%/90%/80% occ by decade
Bencoolen
99LH
Sunshine Plaza
S$1,022,150 S$1,900 psf
538 sqft · DT21 Bencoolen MRT Station
Agent: Nicholl Wan
1 other agent(s) listing this unit
📊 Financial Analysis · tap to collapse
📊 Financial Model
A: own-use · B: investment · both 80% LTV · 1.4% p.a. · 17% corp tax
Remaining lease
75 yrs remaining
Expires ~2101
Acquisition costs
| Purchase price | S$1,022,150 |
| BSD (non-residential) | S$25,486 |
| Legal fees (est.) | S$3,500 |
| ↳ Down payment (20%) + BSD + legal | S$233,416 |
| ↳ Loan (80%) | S$817,720 |
| ↳ Scenario B equity (same) | S$233,416 |
Monthly mortgage & opex
| Mgmt fee (0.70 psf/mo) | S$377 |
| Property tax (10% of AV S$32,280) | S$269 |
Rental scenarios
A · Own-use (80% LTV)
Rent covers mortgage + mgmt + property tax
S$3,803 /mo · 7.07 psf
| Mortgage (30yr @ 1.4%) | S$2,783 |
| ↳ interest / principal | S$954 / S$1,829 |
| Corp tax (17%) | S$375 |
| Net cash flow | −S$0/mo shortfall |
| Gross yield | 4.46% |
| Cap rate | 3.71% |
9.40%
equity return
cf + principal / equity in
cf + principal / equity in
vs
B · Investment (80% LTV)
Market rent 5.00 psf · equity S$233,416
S$2,690 /mo · 5.00 psf
| Mortgage (30yr @ 1.4%) | S$2,783 |
| ↳ interest / principal | S$954 / S$1,829 |
| Corp tax (17%) | S$185 |
| Net cash flow | −S$924/mo shortfall |
| Gross yield | 3.16% |
| Cap rate | 2.40% |
4.65%
equity return
cf + principal / equity in
cf + principal / equity in
A charges S$3,803/mo to own business vs market rent S$2,690/mo
(+S$1,113/mo vs market).
Yr1 principal paydown: S$21,948/yr (locked equity).
1.4% p.a. (midpoint of 1.2–1.6% market range) · A: own-use · B: investment · both 80% LTV ·
0.70 psf mgmt · 10% property tax on AV · 17% CIT · Non-res BSD · No ABSD.
Market rent based on zone Grade B/C comps. Not financial advice.
📉 Scenario C: Run-to-end (no exit) · tap to expand
📉 Scenario C · Leasehold Run-to-end
No exit sale · 2% rent p.a. · 80% LTV · hold 75 yrs to lease expiry
Loan paydown equity is trapped — cannot be realised without a buyer.
Returns below are purely from net rental cash flows.
Rent & occupancy assumptions
| Yr 1–10 | Company own-use · BE rent · CF ≈ 0 |
| Yr 11–30 | External tenant · 90% occ · market rent |
| Yr 31+ | External tenant · 80% occ · market rent |
| Rent growth | 2% p.a. · decays as lease shortens |
| Property tax | Tracks rent (AV-based) · flat during own-use |
| Terminal / exit value | S$0 |
Cash flow summary
Avg CF over each period. Yr 1–10 ≈ S$0/yr (BE rent covers costs). Turns positive post-loan.
| Equity invested (80% LTV) | S$233,416 |
| Avg annual CF · loan period (30 yrs) | S$-3,210/yr S$-267/mo |
| Avg annual CF · post-loan (45 yrs) | S$48,072/yr S$4,006/mo |
| Total cash back over 75 yrs | S$2,066,950 |
| Net profit / (loss) | +S$1,833,534 |
3.9%
IRR over 75 yrs
no exit · 2% rent p.a. · 100%/90%/80% occ by decade
no exit · 2% rent p.a. · 100%/90%/80% occ by decade
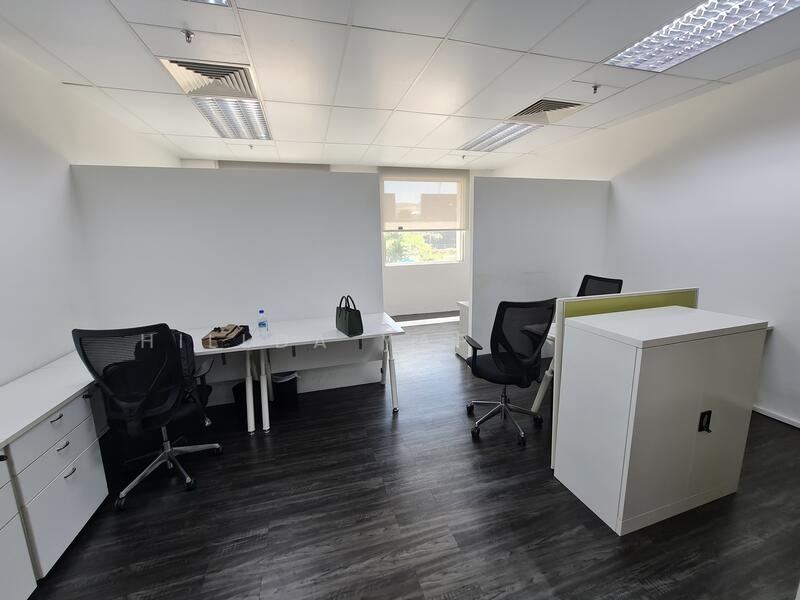
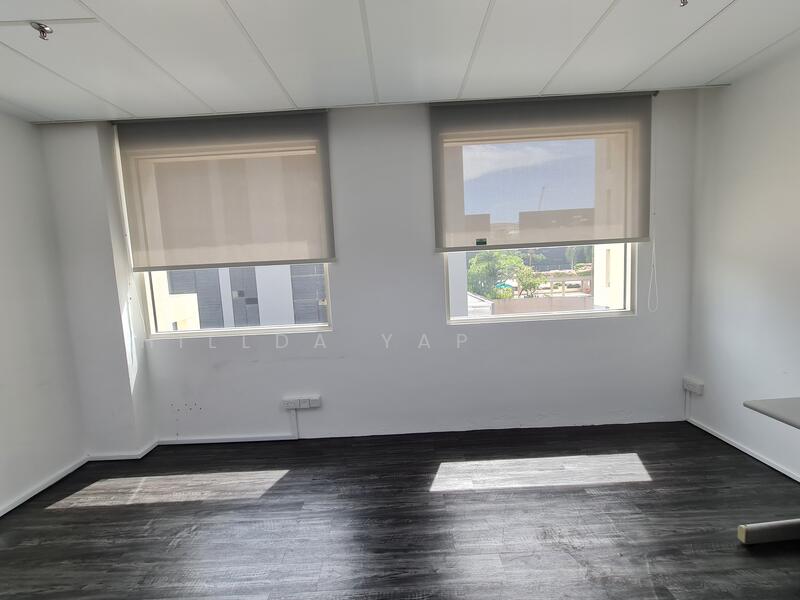
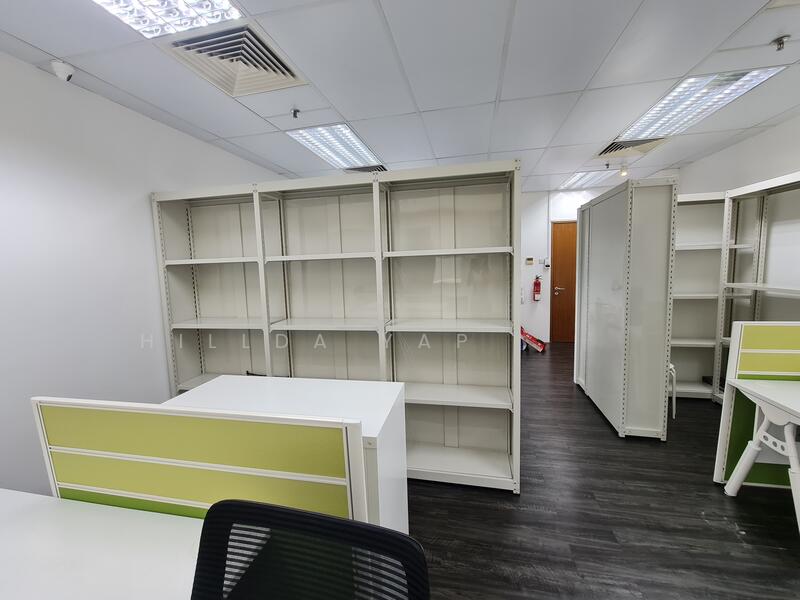
Bencoolen
99LH
Burlington Square
S$1,050,000 S$1,842 psf
570 sqft · DT13 Rochor MRT Station
Agent: Hillda Yap
📊 Financial Analysis · tap to collapse
📊 Financial Model
A: own-use · B: investment · both 80% LTV · 1.4% p.a. · 17% corp tax
Remaining lease
74 yrs remaining
Expires ~2100
Acquisition costs
| Purchase price | S$1,050,000 |
| BSD (non-residential) | S$26,600 |
| Legal fees (est.) | S$3,500 |
| ↳ Down payment (20%) + BSD + legal | S$240,100 |
| ↳ Loan (80%) | S$840,000 |
| ↳ Scenario B equity (same) | S$240,100 |
Monthly mortgage & opex
| Mgmt fee (0.70 psf/mo) | S$399 |
| Property tax (10% of AV S$34,200) | S$285 |
Rental scenarios
A · Own-use (80% LTV)
Rent covers mortgage + mgmt + property tax
S$3,928 /mo · 6.89 psf
| Mortgage (30yr @ 1.4%) | S$2,859 |
| ↳ interest / principal | S$980 / S$1,879 |
| Corp tax (17%) | S$385 |
| Net cash flow | +S$0/mo surplus |
| Gross yield | 4.49% |
| Cap rate | 3.71% |
9.39%
equity return
cf + principal / equity in
cf + principal / equity in
vs
B · Investment (80% LTV)
Market rent 5.00 psf · equity S$240,100
S$2,850 /mo · 5.00 psf
| Mortgage (30yr @ 1.4%) | S$2,859 |
| ↳ interest / principal | S$980 / S$1,879 |
| Corp tax (17%) | S$202 |
| Net cash flow | −S$894/mo shortfall |
| Gross yield | 3.26% |
| Cap rate | 2.48% |
4.92%
equity return
cf + principal / equity in
cf + principal / equity in
A charges S$3,928/mo to own business vs market rent S$2,850/mo
(+S$1,078/mo vs market).
Yr1 principal paydown: S$22,546/yr (locked equity).
1.4% p.a. (midpoint of 1.2–1.6% market range) · A: own-use · B: investment · both 80% LTV ·
0.70 psf mgmt · 10% property tax on AV · 17% CIT · Non-res BSD · No ABSD.
Market rent based on zone Grade B/C comps. Not financial advice.
📉 Scenario C: Run-to-end (no exit) · tap to expand
📉 Scenario C · Leasehold Run-to-end
No exit sale · 2% rent p.a. · 80% LTV · hold 74 yrs to lease expiry
Loan paydown equity is trapped — cannot be realised without a buyer.
Returns below are purely from net rental cash flows.
Rent & occupancy assumptions
| Yr 1–10 | Company own-use · BE rent · CF ≈ 0 |
| Yr 11–30 | External tenant · 90% occ · market rent |
| Yr 31+ | External tenant · 80% occ · market rent |
| Rent growth | 2% p.a. · decays as lease shortens |
| Property tax | Tracks rent (AV-based) · flat during own-use |
| Terminal / exit value | S$0 |
Cash flow summary
Avg CF over each period. Yr 1–10 ≈ S$0/yr (BE rent covers costs). Turns positive post-loan.
| Equity invested (80% LTV) | S$240,100 |
| Avg annual CF · loan period (30 yrs) | S$-2,694/yr S$-224/mo |
| Avg annual CF · post-loan (44 yrs) | S$50,276/yr S$4,190/mo |
| Total cash back over 74 yrs | S$2,131,339 |
| Net profit / (loss) | +S$1,891,239 |
4.0%
IRR over 74 yrs
no exit · 2% rent p.a. · 100%/90%/80% occ by decade
no exit · 2% rent p.a. · 100%/90%/80% occ by decade
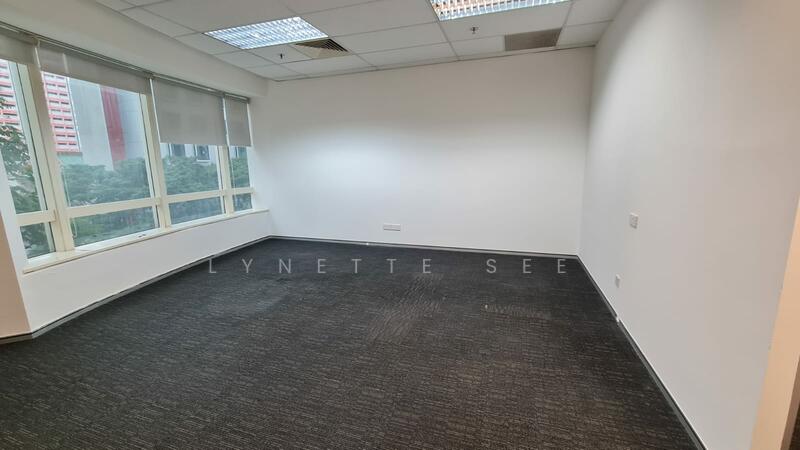
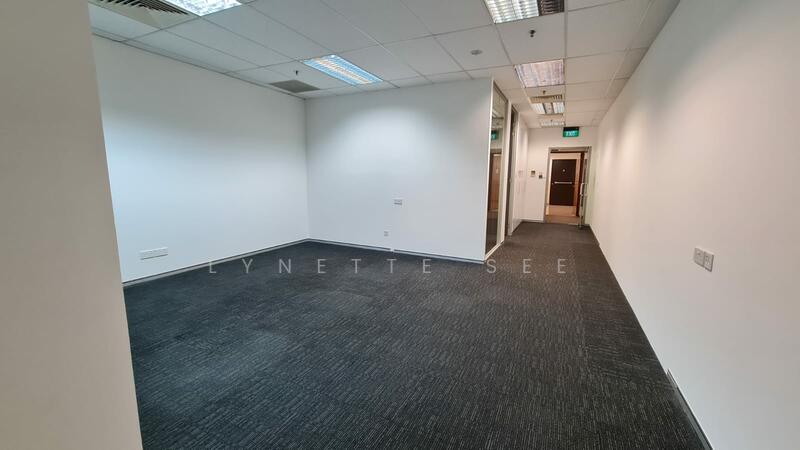
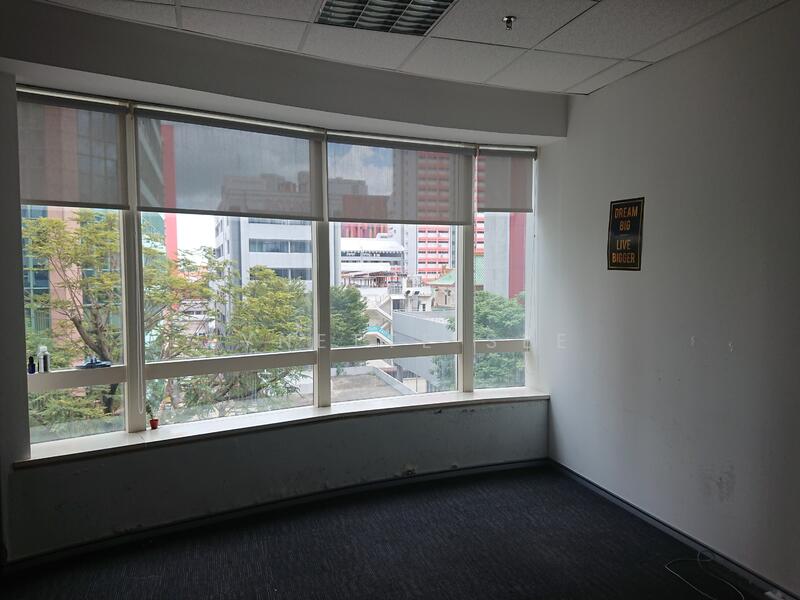
Bencoolen
99LH
Burlington Square
S$1,050,000 S$1,913 psf
549 sqft · DT13 Rochor MRT Station
Agent: Lynette See
📊 Financial Analysis · tap to collapse
📊 Financial Model
A: own-use · B: investment · both 80% LTV · 1.4% p.a. · 17% corp tax
Remaining lease
74 yrs remaining
Expires ~2100
Acquisition costs
| Purchase price | S$1,050,000 |
| BSD (non-residential) | S$26,600 |
| Legal fees (est.) | S$3,500 |
| ↳ Down payment (20%) + BSD + legal | S$240,100 |
| ↳ Loan (80%) | S$840,000 |
| ↳ Scenario B equity (same) | S$240,100 |
Monthly mortgage & opex
| Mgmt fee (0.70 psf/mo) | S$384 |
| Property tax (10% of AV S$32,940) | S$274 |
Rental scenarios
A · Own-use (80% LTV)
Rent covers mortgage + mgmt + property tax
S$3,903 /mo · 7.11 psf
| Mortgage (30yr @ 1.4%) | S$2,859 |
| ↳ interest / principal | S$980 / S$1,879 |
| Corp tax (17%) | S$385 |
| Net cash flow | +S$0/mo surplus |
| Gross yield | 4.46% |
| Cap rate | 3.71% |
9.39%
equity return
cf + principal / equity in
cf + principal / equity in
vs
B · Investment (80% LTV)
Market rent 5.00 psf · equity S$240,100
S$2,745 /mo · 5.00 psf
| Mortgage (30yr @ 1.4%) | S$2,859 |
| ↳ interest / principal | S$980 / S$1,879 |
| Corp tax (17%) | S$188 |
| Net cash flow | −S$961/mo shortfall |
| Gross yield | 3.14% |
| Cap rate | 2.38% |
4.59%
equity return
cf + principal / equity in
cf + principal / equity in
A charges S$3,903/mo to own business vs market rent S$2,745/mo
(+S$1,158/mo vs market).
Yr1 principal paydown: S$22,546/yr (locked equity).
1.4% p.a. (midpoint of 1.2–1.6% market range) · A: own-use · B: investment · both 80% LTV ·
0.70 psf mgmt · 10% property tax on AV · 17% CIT · Non-res BSD · No ABSD.
Market rent based on zone Grade B/C comps. Not financial advice.
📉 Scenario C: Run-to-end (no exit) · tap to expand
📉 Scenario C · Leasehold Run-to-end
No exit sale · 2% rent p.a. · 80% LTV · hold 74 yrs to lease expiry
Loan paydown equity is trapped — cannot be realised without a buyer.
Returns below are purely from net rental cash flows.
Rent & occupancy assumptions
| Yr 1–10 | Company own-use · BE rent · CF ≈ 0 |
| Yr 11–30 | External tenant · 90% occ · market rent |
| Yr 31+ | External tenant · 80% occ · market rent |
| Rent growth | 2% p.a. · decays as lease shortens |
| Property tax | Tracks rent (AV-based) · flat during own-use |
| Terminal / exit value | S$0 |
Cash flow summary
Avg CF over each period. Yr 1–10 ≈ S$0/yr (BE rent covers costs). Turns positive post-loan.
| Equity invested (80% LTV) | S$240,100 |
| Avg annual CF · loan period (30 yrs) | S$-3,421/yr S$-285/mo |
| Avg annual CF · post-loan (44 yrs) | S$48,424/yr S$4,035/mo |
| Total cash back over 74 yrs | S$2,028,007 |
| Net profit / (loss) | +S$1,787,907 |
3.8%
IRR over 74 yrs
no exit · 2% rent p.a. · 100%/90%/80% occ by decade
no exit · 2% rent p.a. · 100%/90%/80% occ by decade
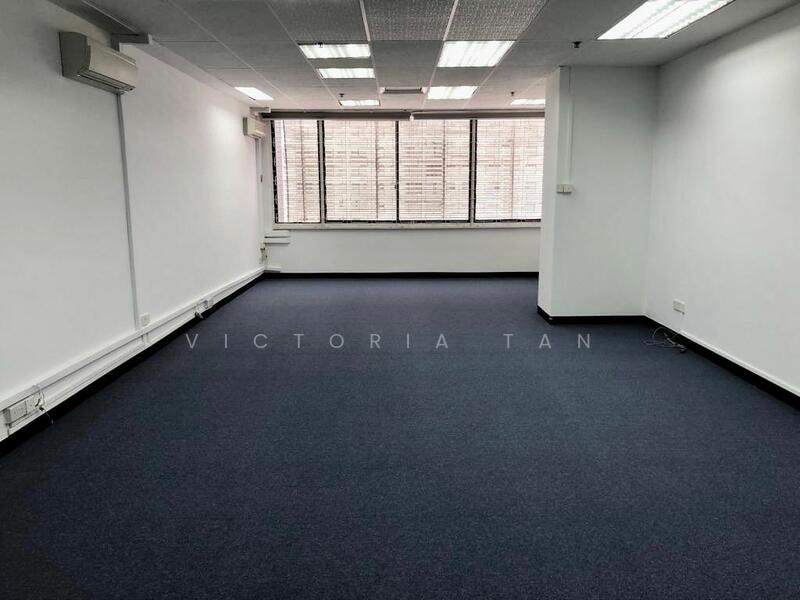
Bencoolen
99LH
Parklane Shopping Mall
S$934,650 S$1,550 psf
603 sqft · DT21 Bencoolen MRT Station
Agent: Victoria Tan
📊 Financial Analysis · tap to collapse
📊 Financial Model
A: own-use · B: investment · both 80% LTV · 1.4% p.a. · 17% corp tax
Remaining lease
43 yrs remaining
Expires ~2069
Acquisition costs
| Purchase price | S$934,650 |
| BSD (non-residential) | S$22,640 |
| Legal fees (est.) | S$3,500 |
| ↳ Down payment (20%) + BSD + legal | S$213,070 |
| ↳ Loan (80%) | S$747,720 |
| ↳ Scenario B equity (same) | S$213,070 |
Monthly mortgage & opex
| Mgmt fee (0.70 psf/mo) | S$422 |
| Property tax (10% of AV S$36,180) | S$302 |
Rental scenarios
A · Own-use (80% LTV)
Rent covers mortgage + mgmt + property tax
S$3,611 /mo · 5.99 psf
| Mortgage (30yr @ 1.4%) | S$2,545 |
| ↳ interest / principal | S$872 / S$1,672 |
| Corp tax (17%) | S$343 |
| Net cash flow | +S$0/mo surplus |
| Gross yield | 4.64% |
| Cap rate | 3.71% |
9.42%
equity return
cf + principal / equity in
cf + principal / equity in
vs
B · Investment (80% LTV)
Market rent 5.00 psf · equity S$213,070
S$3,015 /mo · 5.00 psf
| Mortgage (30yr @ 1.4%) | S$2,545 |
| ↳ interest / principal | S$872 / S$1,672 |
| Corp tax (17%) | S$241 |
| Net cash flow | −S$495/mo shortfall |
| Gross yield | 3.87% |
| Cap rate | 2.94% |
6.63%
equity return
cf + principal / equity in
cf + principal / equity in
A charges S$3,611/mo to own business vs market rent S$3,015/mo
(+S$596/mo vs market).
Yr1 principal paydown: S$20,070/yr (locked equity).
1.4% p.a. (midpoint of 1.2–1.6% market range) · A: own-use · B: investment · both 80% LTV ·
0.70 psf mgmt · 10% property tax on AV · 17% CIT · Non-res BSD · No ABSD.
Market rent based on zone Grade B/C comps. Not financial advice.
📉 Scenario C: Run-to-end (no exit) · tap to expand
📉 Scenario C · Leasehold Run-to-end
No exit sale · 2% rent p.a. · 80% LTV · hold 43 yrs to lease expiry
Loan paydown equity is trapped — cannot be realised without a buyer.
Returns below are purely from net rental cash flows.
Rent & occupancy assumptions
| Yr 1–10 | Company own-use · BE rent · CF ≈ 0 |
| Yr 11–30 | External tenant · 90% occ · market rent |
| Yr 31+ | External tenant · 80% occ · market rent |
| Rent growth | 2% p.a. · decays as lease shortens |
| Property tax | Tracks rent (AV-based) · flat during own-use |
| Terminal / exit value | S$0 |
Cash flow summary
Avg CF over each period. Yr 1–10 ≈ S$0/yr (BE rent covers costs). Turns positive post-loan.
| Equity invested (80% LTV) | S$213,070 |
| Avg annual CF · loan period (30 yrs) | S$495/yr S$41/mo |
| Avg annual CF · post-loan (13 yrs) | S$34,603/yr S$2,884/mo |
| Total cash back over 43 yrs | S$464,682 |
| Net profit / (loss) | +S$251,612 |
2.1%
IRR over 43 yrs
no exit · 2% rent p.a. · 100%/90%/80% occ by decade
no exit · 2% rent p.a. · 100%/90%/80% occ by decade
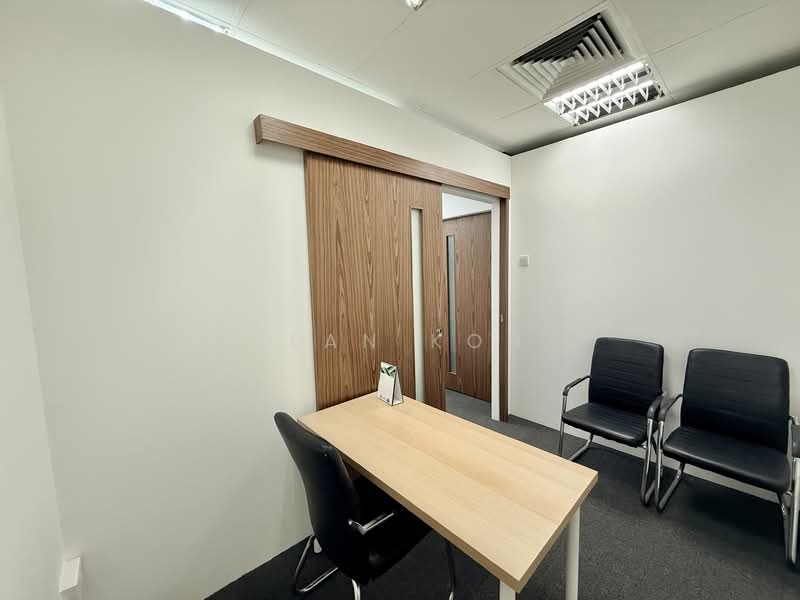
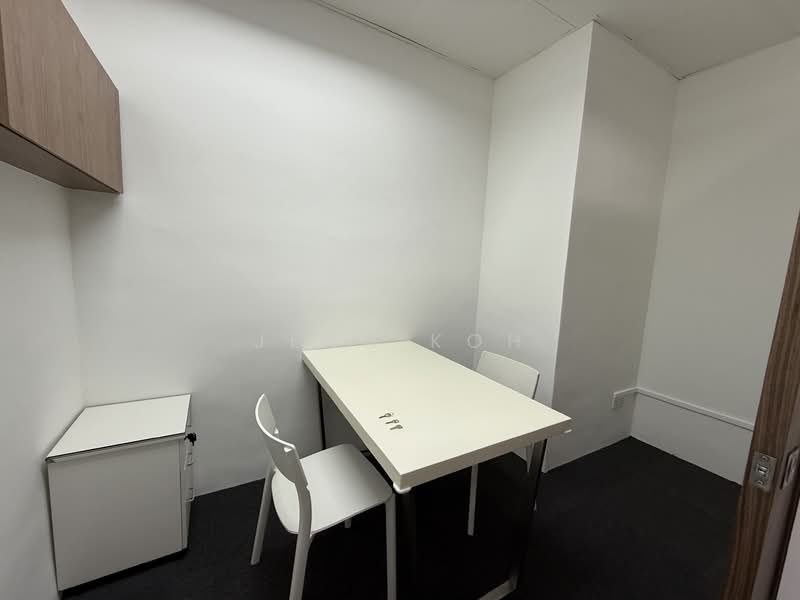
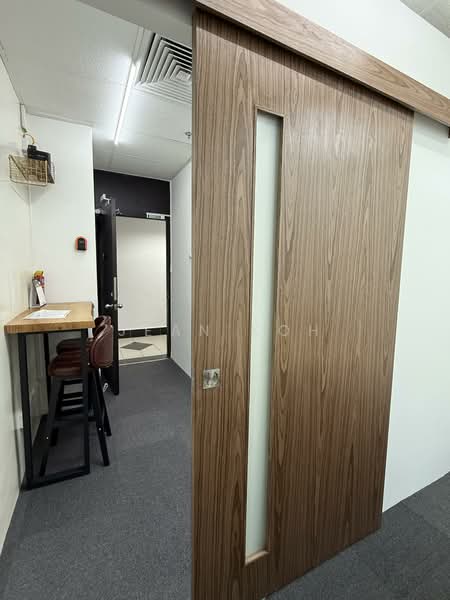
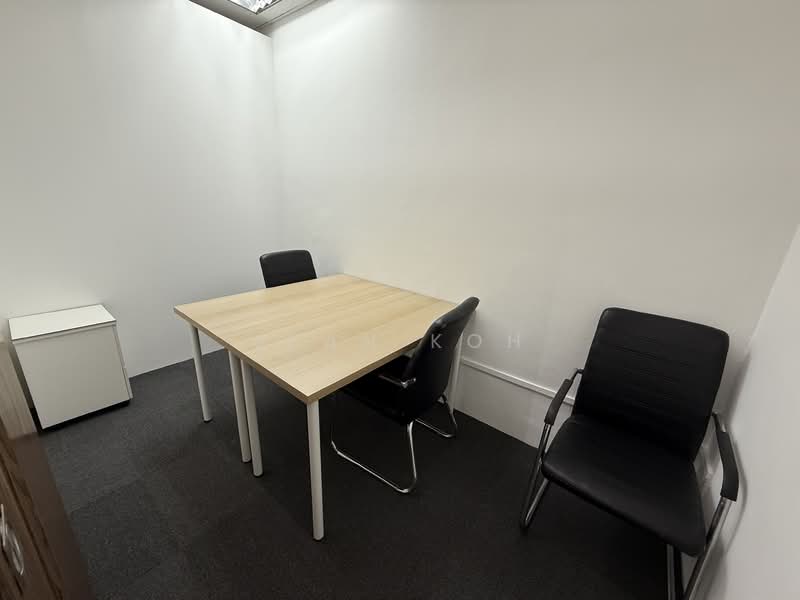
Bencoolen
99LH
Parklane Shopping Mall
S$538,000 S$1,921 psf
280 sqft · DT21 Bencoolen MRT Station
Agent: Jean Koh
📊 Financial Analysis · tap to collapse
📊 Financial Model
A: own-use · B: investment · both 80% LTV · 1.4% p.a. · 17% corp tax
Remaining lease
43 yrs remaining
Expires ~2069
Acquisition costs
| Purchase price | S$538,000 |
| BSD (non-residential) | S$10,740 |
| Legal fees (est.) | S$3,500 |
| ↳ Down payment (20%) + BSD + legal | S$121,840 |
| ↳ Loan (80%) | S$430,400 |
| ↳ Scenario B equity (same) | S$121,840 |
Monthly mortgage & opex
| Mgmt fee (0.70 psf/mo) | S$196 |
| Property tax (10% of AV S$16,800) | S$140 |
Rental scenarios
A · Own-use (80% LTV)
Rent covers mortgage + mgmt + property tax
S$1,998 /mo · 7.14 psf
| Mortgage (30yr @ 1.4%) | S$1,465 |
| ↳ interest / principal | S$502 / S$963 |
| Corp tax (17%) | S$197 |
| Net cash flow | −S$0/mo shortfall |
| Gross yield | 4.46% |
| Cap rate | 3.71% |
9.48%
equity return
cf + principal / equity in
cf + principal / equity in
vs
B · Investment (80% LTV)
Market rent 5.00 psf · equity S$121,840
S$1,400 /mo · 5.00 psf
| Mortgage (30yr @ 1.4%) | S$1,465 |
| ↳ interest / principal | S$502 / S$963 |
| Corp tax (17%) | S$96 |
| Net cash flow | −S$496/mo shortfall |
| Gross yield | 3.12% |
| Cap rate | 2.37% |
4.59%
equity return
cf + principal / equity in
cf + principal / equity in
A charges S$1,998/mo to own business vs market rent S$1,400/mo
(+S$598/mo vs market).
Yr1 principal paydown: S$11,552/yr (locked equity).
1.4% p.a. (midpoint of 1.2–1.6% market range) · A: own-use · B: investment · both 80% LTV ·
0.70 psf mgmt · 10% property tax on AV · 17% CIT · Non-res BSD · No ABSD.
Market rent based on zone Grade B/C comps. Not financial advice.
📉 Scenario C: Run-to-end (no exit) · tap to expand
📉 Scenario C · Leasehold Run-to-end
No exit sale · 2% rent p.a. · 80% LTV · hold 43 yrs to lease expiry
Loan paydown equity is trapped — cannot be realised without a buyer.
Returns below are purely from net rental cash flows.
Rent & occupancy assumptions
| Yr 1–10 | Company own-use · BE rent · CF ≈ 0 |
| Yr 11–30 | External tenant · 90% occ · market rent |
| Yr 31+ | External tenant · 80% occ · market rent |
| Rent growth | 2% p.a. · decays as lease shortens |
| Property tax | Tracks rent (AV-based) · flat during own-use |
| Terminal / exit value | S$0 |
Cash flow summary
Avg CF over each period. Yr 1–10 ≈ S$0/yr (BE rent covers costs). Turns positive post-loan.
| Equity invested (80% LTV) | S$121,840 |
| Avg annual CF · loan period (30 yrs) | S$-1,996/yr S$-166/mo |
| Avg annual CF · post-loan (13 yrs) | S$16,068/yr S$1,339/mo |
| Total cash back over 43 yrs | S$149,016 |
| Net profit / (loss) | +S$27,176 |
0.4%
IRR over 43 yrs
no exit · 2% rent p.a. · 100%/90%/80% occ by decade
no exit · 2% rent p.a. · 100%/90%/80% occ by decade
Raffles Place
LH
High Street Centre
S$1,100,000 S$2,000 psf
550 sqft · NE5 Clarke Quay MRT Station
Agent: Mike
📊 Financial Analysis · tap to collapse
📊 Financial Model
A: own-use · B: investment · both 80% LTV · 1.4% p.a. · 17% corp tax
Remaining lease
50 yrs remaining
Expires ~2076
Acquisition costs
| Purchase price | S$1,100,000 |
| BSD (non-residential) | S$28,600 |
| Legal fees (est.) | S$3,500 |
| ↳ Down payment (20%) + BSD + legal | S$252,100 |
| ↳ Loan (80%) | S$880,000 |
| ↳ Scenario B equity (same) | S$252,100 |
Monthly mortgage & opex
| Mgmt fee (0.80 psf/mo) | S$440 |
| Property tax (10% of AV S$42,900) | S$358 |
Rental scenarios
A · Own-use (80% LTV)
Rent covers mortgage + mgmt + property tax
S$4,196 /mo · 7.63 psf
| Mortgage (30yr @ 1.4%) | S$2,995 |
| ↳ interest / principal | S$1,027 / S$1,968 |
| Corp tax (17%) | S$403 |
| Net cash flow | +S$0/mo surplus |
| Gross yield | 4.58% |
| Cap rate | 3.71% |
9.37%
equity return
cf + principal / equity in
cf + principal / equity in
vs
B · Investment (80% LTV)
Market rent 6.50 psf · equity S$252,100
S$3,575 /mo · 6.50 psf
| Mortgage (30yr @ 1.4%) | S$2,995 |
| ↳ interest / principal | S$1,027 / S$1,968 |
| Corp tax (17%) | S$298 |
| Net cash flow | −S$515/mo shortfall |
| Gross yield | 3.90% |
| Cap rate | 3.03% |
6.92%
equity return
cf + principal / equity in
cf + principal / equity in
A charges S$4,196/mo to own business vs market rent S$3,575/mo
(+S$621/mo vs market).
Yr1 principal paydown: S$23,620/yr (locked equity).
1.4% p.a. (midpoint of 1.2–1.6% market range) · A: own-use · B: investment · both 80% LTV ·
0.80 psf mgmt · 10% property tax on AV · 17% CIT · Non-res BSD · No ABSD.
Market rent based on zone Grade B/C comps. Not financial advice.
📉 Scenario C: Run-to-end (no exit) · tap to expand
📉 Scenario C · Leasehold Run-to-end
No exit sale · 2% rent p.a. · 80% LTV · hold 50 yrs to lease expiry
Loan paydown equity is trapped — cannot be realised without a buyer.
Returns below are purely from net rental cash flows.
Rent & occupancy assumptions
| Yr 1–10 | Company own-use · BE rent · CF ≈ 0 |
| Yr 11–30 | External tenant · 90% occ · market rent |
| Yr 31+ | External tenant · 80% occ · market rent |
| Rent growth | 2% p.a. · decays as lease shortens |
| Property tax | Tracks rent (AV-based) · flat during own-use |
| Terminal / exit value | S$0 |
Cash flow summary
Avg CF over each period. Yr 1–10 ≈ S$0/yr (BE rent covers costs). Turns positive post-loan.
| Equity invested (80% LTV) | S$252,100 |
| Avg annual CF · loan period (30 yrs) | S$1,527/yr S$127/mo |
| Avg annual CF · post-loan (20 yrs) | S$46,185/yr S$3,849/mo |
| Total cash back over 50 yrs | S$969,507 |
| Net profit / (loss) | +S$717,407 |
3.4%
IRR over 50 yrs
no exit · 2% rent p.a. · 100%/90%/80% occ by decade
no exit · 2% rent p.a. · 100%/90%/80% occ by decade
Raffles Place
LH
High Street Centre
S$1,050,000 S$1,913 psf
549 sqft · NE5 Clarke Quay MRT Station
Agent: Ivy Shua
📊 Financial Analysis · tap to collapse
📊 Financial Model
A: own-use · B: investment · both 80% LTV · 1.4% p.a. · 17% corp tax
Remaining lease
50 yrs remaining
Expires ~2076
Acquisition costs
| Purchase price | S$1,050,000 |
| BSD (non-residential) | S$26,600 |
| Legal fees (est.) | S$3,500 |
| ↳ Down payment (20%) + BSD + legal | S$240,100 |
| ↳ Loan (80%) | S$840,000 |
| ↳ Scenario B equity (same) | S$240,100 |
Monthly mortgage & opex
| Mgmt fee (0.80 psf/mo) | S$439 |
| Property tax (10% of AV S$42,822) | S$357 |
Rental scenarios
A · Own-use (80% LTV)
Rent covers mortgage + mgmt + property tax
S$4,040 /mo · 7.36 psf
| Mortgage (30yr @ 1.4%) | S$2,859 |
| ↳ interest / principal | S$980 / S$1,879 |
| Corp tax (17%) | S$385 |
| Net cash flow | +S$0/mo surplus |
| Gross yield | 4.62% |
| Cap rate | 3.71% |
9.39%
equity return
cf + principal / equity in
cf + principal / equity in
vs
B · Investment (80% LTV)
Market rent 6.50 psf · equity S$240,100
S$3,568 /mo · 6.50 psf
| Mortgage (30yr @ 1.4%) | S$2,859 |
| ↳ interest / principal | S$980 / S$1,879 |
| Corp tax (17%) | S$305 |
| Net cash flow | −S$392/mo shortfall |
| Gross yield | 4.08% |
| Cap rate | 3.17% |
7.43%
equity return
cf + principal / equity in
cf + principal / equity in
A charges S$4,040/mo to own business vs market rent S$3,568/mo
(+S$472/mo vs market).
Yr1 principal paydown: S$22,546/yr (locked equity).
1.4% p.a. (midpoint of 1.2–1.6% market range) · A: own-use · B: investment · both 80% LTV ·
0.80 psf mgmt · 10% property tax on AV · 17% CIT · Non-res BSD · No ABSD.
Market rent based on zone Grade B/C comps. Not financial advice.
📉 Scenario C: Run-to-end (no exit) · tap to expand
📉 Scenario C · Leasehold Run-to-end
No exit sale · 2% rent p.a. · 80% LTV · hold 50 yrs to lease expiry
Loan paydown equity is trapped — cannot be realised without a buyer.
Returns below are purely from net rental cash flows.
Rent & occupancy assumptions
| Yr 1–10 | Company own-use · BE rent · CF ≈ 0 |
| Yr 11–30 | External tenant · 90% occ · market rent |
| Yr 31+ | External tenant · 80% occ · market rent |
| Rent growth | 2% p.a. · decays as lease shortens |
| Property tax | Tracks rent (AV-based) · flat during own-use |
| Terminal / exit value | S$0 |
Cash flow summary
Avg CF over each period. Yr 1–10 ≈ S$0/yr (BE rent covers costs). Turns positive post-loan.
| Equity invested (80% LTV) | S$240,100 |
| Avg annual CF · loan period (30 yrs) | S$2,551/yr S$213/mo |
| Avg annual CF · post-loan (20 yrs) | S$46,101/yr S$3,842/mo |
| Total cash back over 50 yrs | S$998,545 |
| Net profit / (loss) | +S$758,445 |
3.7%
IRR over 50 yrs
no exit · 2% rent p.a. · 100%/90%/80% occ by decade
no exit · 2% rent p.a. · 100%/90%/80% occ by decade
Raffles Place
999LH
Peninsula Plaza
S$918,000 S$2,669 psf
344 sqft · NS25 City Hall MRT Station
Agent: George Rewa
📊 Financial Analysis · tap to collapse
📊 Financial Model
A: own-use · B: investment · both 80% LTV · 1.4% p.a. · 17% corp tax
Remaining lease
Freehold / 999-yr
Expires ~2969
Acquisition costs
| Purchase price | S$918,000 |
| BSD (non-residential) | S$22,140 |
| Legal fees (est.) | S$3,500 |
| ↳ Down payment (20%) + BSD + legal | S$209,240 |
| ↳ Loan (80%) | S$734,400 |
| ↳ Scenario B equity (same) | S$209,240 |
Monthly mortgage & opex
| Mgmt fee (0.80 psf/mo) | S$275 |
| Property tax (10% of AV S$26,832) | S$224 |
Rental scenarios
A · Own-use (80% LTV)
Rent covers mortgage + mgmt + property tax
S$3,335 /mo · 9.69 psf
| Mortgage (30yr @ 1.4%) | S$2,499 |
| ↳ interest / principal | S$857 / S$1,643 |
| Corp tax (17%) | S$336 |
| Net cash flow | +S$0/mo surplus |
| Gross yield | 4.36% |
| Cap rate | 3.71% |
9.42%
equity return
cf + principal / equity in
cf + principal / equity in
vs
B · Investment (80% LTV)
Market rent 6.50 psf · equity S$209,240
S$2,236 /mo · 6.50 psf
| Mortgage (30yr @ 1.4%) | S$2,499 |
| ↳ interest / principal | S$857 / S$1,643 |
| Corp tax (17%) | S$150 |
| Net cash flow | −S$912/mo shortfall |
| Gross yield | 2.92% |
| Cap rate | 2.27% |
4.19%
equity return
cf + principal / equity in
cf + principal / equity in
A charges S$3,335/mo to own business vs market rent S$2,236/mo
(+S$1,099/mo vs market).
Yr1 principal paydown: S$19,712/yr (locked equity).
1.4% p.a. (midpoint of 1.2–1.6% market range) · A: own-use · B: investment · both 80% LTV ·
0.80 psf mgmt · 10% property tax on AV · 17% CIT · Non-res BSD · No ABSD.
Market rent based on zone Grade B/C comps. Not financial advice.
Raffles Place
999LH
High Street Plaza
S$930,000 S$2,879 psf
323 sqft · NS25 City Hall MRT Station
Agent: Able S.K Toh
📊 Financial Analysis · tap to collapse
📊 Financial Model
A: own-use · B: investment · both 80% LTV · 1.4% p.a. · 17% corp tax
Remaining lease
Freehold / 999-yr
Expires ~2969
Acquisition costs
| Purchase price | S$930,000 |
| BSD (non-residential) | S$22,500 |
| Legal fees (est.) | S$3,500 |
| ↳ Down payment (20%) + BSD + legal | S$212,000 |
| ↳ Loan (80%) | S$744,000 |
| ↳ Scenario B equity (same) | S$212,000 |
Monthly mortgage & opex
| Mgmt fee (0.80 psf/mo) | S$258 |
| Property tax (10% of AV S$25,194) | S$210 |
Rental scenarios
A · Own-use (80% LTV)
Rent covers mortgage + mgmt + property tax
S$3,341 /mo · 10.34 psf
| Mortgage (30yr @ 1.4%) | S$2,532 |
| ↳ interest / principal | S$868 / S$1,664 |
| Corp tax (17%) | S$341 |
| Net cash flow | −S$0/mo shortfall |
| Gross yield | 4.31% |
| Cap rate | 3.71% |
9.42%
equity return
cf + principal / equity in
cf + principal / equity in
vs
B · Investment (80% LTV)
Market rent 6.50 psf · equity S$212,000
S$2,100 /mo · 6.50 psf
| Mortgage (30yr @ 1.4%) | S$2,532 |
| ↳ interest / principal | S$868 / S$1,664 |
| Corp tax (17%) | S$130 |
| Net cash flow | −S$1,030/mo shortfall |
| Gross yield | 2.71% |
| Cap rate | 2.11% |
3.59%
equity return
cf + principal / equity in
cf + principal / equity in
A charges S$3,341/mo to own business vs market rent S$2,100/mo
(+S$1,241/mo vs market).
Yr1 principal paydown: S$19,970/yr (locked equity).
1.4% p.a. (midpoint of 1.2–1.6% market range) · A: own-use · B: investment · both 80% LTV ·
0.80 psf mgmt · 10% property tax on AV · 17% CIT · Non-res BSD · No ABSD.
Market rent based on zone Grade B/C comps. Not financial advice.
Raffles Place
99LH
People's Park Complex
S$788,000 S$1,628 psf
484 sqft · NE4 Chinatown MRT Station
Agent: Bjorn Chua
📊 Financial Analysis · tap to collapse
📊 Financial Model
A: own-use · B: investment · both 80% LTV · 1.4% p.a. · 17% corp tax
Remaining lease
40 yrs remaining
Expires ~2066
Acquisition costs
| Purchase price | S$788,000 |
| BSD (non-residential) | S$18,240 |
| Legal fees (est.) | S$3,500 |
| ↳ Down payment (20%) + BSD + legal | S$179,340 |
| ↳ Loan (80%) | S$630,400 |
| ↳ Scenario B equity (same) | S$179,340 |
Monthly mortgage & opex
| Mgmt fee (0.80 psf/mo) | S$387 |
| Property tax (10% of AV S$37,752) | S$315 |
Rental scenarios
A · Own-use (80% LTV)
Rent covers mortgage + mgmt + property tax
S$3,136 /mo · 6.48 psf
| Mortgage (30yr @ 1.4%) | S$2,146 |
| ↳ interest / principal | S$735 / S$1,410 |
| Corp tax (17%) | S$289 |
| Net cash flow | −S$0/mo shortfall |
| Gross yield | 4.78% |
| Cap rate | 3.71% |
9.43%
equity return
cf + principal / equity in
cf + principal / equity in
vs
B · Investment (80% LTV)
Market rent 6.50 psf · equity S$179,340
S$3,146 /mo · 6.50 psf
| Mortgage (30yr @ 1.4%) | S$2,146 |
| ↳ interest / principal | S$735 / S$1,410 |
| Corp tax (17%) | S$290 |
| Net cash flow | +S$8/mo surplus |
| Gross yield | 4.79% |
| Cap rate | 3.72% |
9.49%
equity return
cf + principal / equity in
cf + principal / equity in
A charges S$3,136/mo to own business vs market rent S$3,146/mo
(−S$10/mo vs market).
Yr1 principal paydown: S$16,921/yr (locked equity).
1.4% p.a. (midpoint of 1.2–1.6% market range) · A: own-use · B: investment · both 80% LTV ·
0.80 psf mgmt · 10% property tax on AV · 17% CIT · Non-res BSD · No ABSD.
Market rent based on zone Grade B/C comps. Not financial advice.
📉 Scenario C: Run-to-end (no exit) · tap to expand
📉 Scenario C · Leasehold Run-to-end
No exit sale · 2% rent p.a. · 80% LTV · hold 40 yrs to lease expiry
Loan paydown equity is trapped — cannot be realised without a buyer.
Returns below are purely from net rental cash flows.
Rent & occupancy assumptions
| Yr 1–10 | Company own-use · BE rent · CF ≈ 0 |
| Yr 11–30 | External tenant · 90% occ · market rent |
| Yr 31+ | External tenant · 80% occ · market rent |
| Rent growth | 2% p.a. · decays as lease shortens |
| Property tax | Tracks rent (AV-based) · flat during own-use |
| Terminal / exit value | S$0 |
Cash flow summary
Avg CF over each period. Yr 1–10 ≈ S$0/yr (BE rent covers costs). Turns positive post-loan.
| Equity invested (80% LTV) | S$179,340 |
| Avg annual CF · loan period (30 yrs) | S$4,651/yr S$388/mo |
| Avg annual CF · post-loan (10 yrs) | S$34,948/yr S$2,912/mo |
| Total cash back over 40 yrs | S$489,007 |
| Net profit / (loss) | +S$309,667 |
3.3%
IRR over 40 yrs
no exit · 2% rent p.a. · 100%/90%/80% occ by decade
no exit · 2% rent p.a. · 100%/90%/80% occ by decade
Raffles Place
LH
High Street Centre
S$838,000 S$1,731 psf
484 sqft · NE5 Clarke Quay MRT Station
Agent: Toon Hwang Ong
📊 Financial Analysis · tap to collapse
📊 Financial Model
A: own-use · B: investment · both 80% LTV · 1.4% p.a. · 17% corp tax
Remaining lease
50 yrs remaining
Expires ~2076
Acquisition costs
| Purchase price | S$838,000 |
| BSD (non-residential) | S$19,740 |
| Legal fees (est.) | S$3,500 |
| ↳ Down payment (20%) + BSD + legal | S$190,840 |
| ↳ Loan (80%) | S$670,400 |
| ↳ Scenario B equity (same) | S$190,840 |
Monthly mortgage & opex
| Mgmt fee (0.80 psf/mo) | S$387 |
| Property tax (10% of AV S$37,752) | S$315 |
Rental scenarios
A · Own-use (80% LTV)
Rent covers mortgage + mgmt + property tax
S$3,291 /mo · 6.80 psf
| Mortgage (30yr @ 1.4%) | S$2,282 |
| ↳ interest / principal | S$782 / S$1,500 |
| Corp tax (17%) | S$307 |
| Net cash flow | +S$0/mo surplus |
| Gross yield | 4.71% |
| Cap rate | 3.71% |
9.43%
equity return
cf + principal / equity in
cf + principal / equity in
vs
B · Investment (80% LTV)
Market rent 6.50 psf · equity S$190,840
S$3,146 /mo · 6.50 psf
| Mortgage (30yr @ 1.4%) | S$2,282 |
| ↳ interest / principal | S$782 / S$1,500 |
| Corp tax (17%) | S$283 |
| Net cash flow | −S$120/mo shortfall |
| Gross yield | 4.51% |
| Cap rate | 3.50% |
8.67%
equity return
cf + principal / equity in
cf + principal / equity in
A charges S$3,291/mo to own business vs market rent S$3,146/mo
(+S$145/mo vs market).
Yr1 principal paydown: S$17,994/yr (locked equity).
1.4% p.a. (midpoint of 1.2–1.6% market range) · A: own-use · B: investment · both 80% LTV ·
0.80 psf mgmt · 10% property tax on AV · 17% CIT · Non-res BSD · No ABSD.
Market rent based on zone Grade B/C comps. Not financial advice.
📉 Scenario C: Run-to-end (no exit) · tap to expand
📉 Scenario C · Leasehold Run-to-end
No exit sale · 2% rent p.a. · 80% LTV · hold 50 yrs to lease expiry
Loan paydown equity is trapped — cannot be realised without a buyer.
Returns below are purely from net rental cash flows.
Rent & occupancy assumptions
| Yr 1–10 | Company own-use · BE rent · CF ≈ 0 |
| Yr 11–30 | External tenant · 90% occ · market rent |
| Yr 31+ | External tenant · 80% occ · market rent |
| Rent growth | 2% p.a. · decays as lease shortens |
| Property tax | Tracks rent (AV-based) · flat during own-use |
| Terminal / exit value | S$0 |
Cash flow summary
Avg CF over each period. Yr 1–10 ≈ S$0/yr (BE rent covers costs). Turns positive post-loan.
| Equity invested (80% LTV) | S$190,840 |
| Avg annual CF · loan period (30 yrs) | S$4,126/yr S$344/mo |
| Avg annual CF · post-loan (20 yrs) | S$40,642/yr S$3,387/mo |
| Total cash back over 50 yrs | S$936,620 |
| Net profit / (loss) | +S$745,780 |
4.4%
IRR over 50 yrs
no exit · 2% rent p.a. · 100%/90%/80% occ by decade
no exit · 2% rent p.a. · 100%/90%/80% occ by decade
Raffles Place
99LH
People's Park Centre
S$788,000 S$1,833 psf
430 sqft · NE4 Chinatown MRT Station
Agent: Kenny Seah 谢炳清
📊 Financial Analysis · tap to collapse
📊 Financial Model
A: own-use · B: investment · both 80% LTV · 1.4% p.a. · 17% corp tax
Remaining lease
43 yrs remaining
Expires ~2069
Acquisition costs
| Purchase price | S$788,000 |
| BSD (non-residential) | S$18,240 |
| Legal fees (est.) | S$3,500 |
| ↳ Down payment (20%) + BSD + legal | S$179,340 |
| ↳ Loan (80%) | S$630,400 |
| ↳ Scenario B equity (same) | S$179,340 |
Monthly mortgage & opex
| Mgmt fee (0.80 psf/mo) | S$344 |
| Property tax (10% of AV S$33,540) | S$280 |
Rental scenarios
A · Own-use (80% LTV)
Rent covers mortgage + mgmt + property tax
S$3,058 /mo · 7.11 psf
| Mortgage (30yr @ 1.4%) | S$2,146 |
| ↳ interest / principal | S$735 / S$1,410 |
| Corp tax (17%) | S$289 |
| Net cash flow | +S$0/mo surplus |
| Gross yield | 4.66% |
| Cap rate | 3.71% |
9.44%
equity return
cf + principal / equity in
cf + principal / equity in
vs
B · Investment (80% LTV)
Market rent 6.50 psf · equity S$179,340
S$2,795 /mo · 6.50 psf
| Mortgage (30yr @ 1.4%) | S$2,146 |
| ↳ interest / principal | S$735 / S$1,410 |
| Corp tax (17%) | S$244 |
| Net cash flow | −S$218/mo shortfall |
| Gross yield | 4.26% |
| Cap rate | 3.31% |
7.98%
equity return
cf + principal / equity in
cf + principal / equity in
A charges S$3,058/mo to own business vs market rent S$2,795/mo
(+S$263/mo vs market).
Yr1 principal paydown: S$16,921/yr (locked equity).
1.4% p.a. (midpoint of 1.2–1.6% market range) · A: own-use · B: investment · both 80% LTV ·
0.80 psf mgmt · 10% property tax on AV · 17% CIT · Non-res BSD · No ABSD.
Market rent based on zone Grade B/C comps. Not financial advice.
📉 Scenario C: Run-to-end (no exit) · tap to expand
📉 Scenario C · Leasehold Run-to-end
No exit sale · 2% rent p.a. · 80% LTV · hold 43 yrs to lease expiry
Loan paydown equity is trapped — cannot be realised without a buyer.
Returns below are purely from net rental cash flows.
Rent & occupancy assumptions
| Yr 1–10 | Company own-use · BE rent · CF ≈ 0 |
| Yr 11–30 | External tenant · 90% occ · market rent |
| Yr 31+ | External tenant · 80% occ · market rent |
| Rent growth | 2% p.a. · decays as lease shortens |
| Property tax | Tracks rent (AV-based) · flat during own-use |
| Terminal / exit value | S$0 |
Cash flow summary
Avg CF over each period. Yr 1–10 ≈ S$0/yr (BE rent covers costs). Turns positive post-loan.
| Equity invested (80% LTV) | S$179,340 |
| Avg annual CF · loan period (30 yrs) | S$2,451/yr S$204/mo |
| Avg annual CF · post-loan (13 yrs) | S$32,550/yr S$2,712/mo |
| Total cash back over 43 yrs | S$496,690 |
| Net profit / (loss) | +S$317,350 |
3.0%
IRR over 43 yrs
no exit · 2% rent p.a. · 100%/90%/80% occ by decade
no exit · 2% rent p.a. · 100%/90%/80% occ by decade